Artificial intelligence search platforms are shaping how people access information and Perplexity AI sits at the center of that shift. With tens of millions of monthly users and explosive growth across industries, 2026 marks Perplexity’s most transformative year yet.
This report compiles all major Perplexity AI user statistics for 2026, merging demographic data, usage trends, market reach, engagement metrics, industry adoption, device traffic, and behavioral insights into one definitive source.
Whether you’re a marketer, product strategist, investor, or AI enthusiast, this guide gives you the clearest picture available of how Perplexity AI is used and who’s using it.
Perplexity AI User Statistics for 2026: Growth, Usage Trends, and Global Expansion
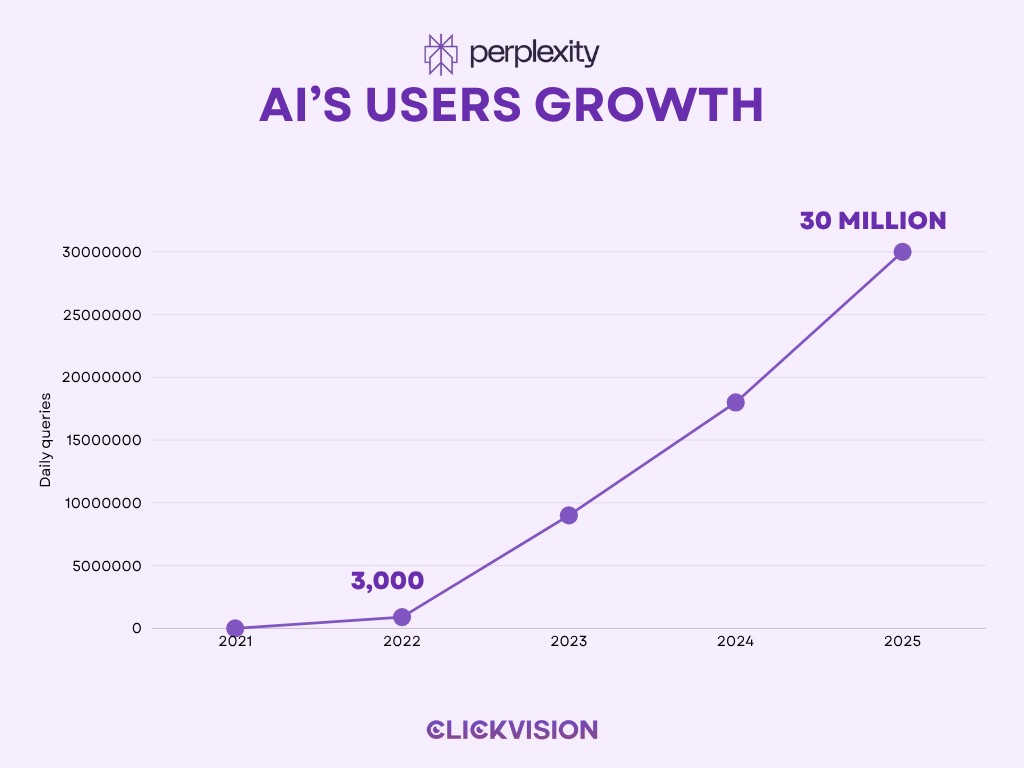
Perplexity AI has rapidly evolved from a niche research assistant into one of the most influential AI-driven search platforms of the decade. Compared to 2022 when it handled just 3,000 queries in a single day in 2025, the company is supporting an estimated 30 million monthly active users, a user base that collectively generates more than 780 million queries every month. Considering these Perplexity AI user growth statistics for 2026, this surge in activity reflects a remarkable 66% year-over-year increase in user growth, positioning Perplexity among the fastest-scaling AI search engines worldwide.
Financially, the platform has reached a significant milestone. Perplexity closed the year with $100 million in annual recurring revenue and an $18 billion valuation, signaling both strong enterprise confidence and sustained market momentum. Its service is now available in more than 150 countries, demonstrating a global footprint comparable to major search incumbents.
What truly separates 2026’s Perplexity from traditional search engines is its user behavior. Individuals rely on it not merely for single-shot fact retrieval but for deep, multi-step reasoning, complex research tasks, and structured information synthesis – behaviors that previously belonged to academic tools, enterprise knowledge systems, or specialized databases.[1]
Perplexity AI User Demographics
These numbers from Perplexity AI user base statistics for 2026 help define who the core Perplexity user really is.
Age Distribution
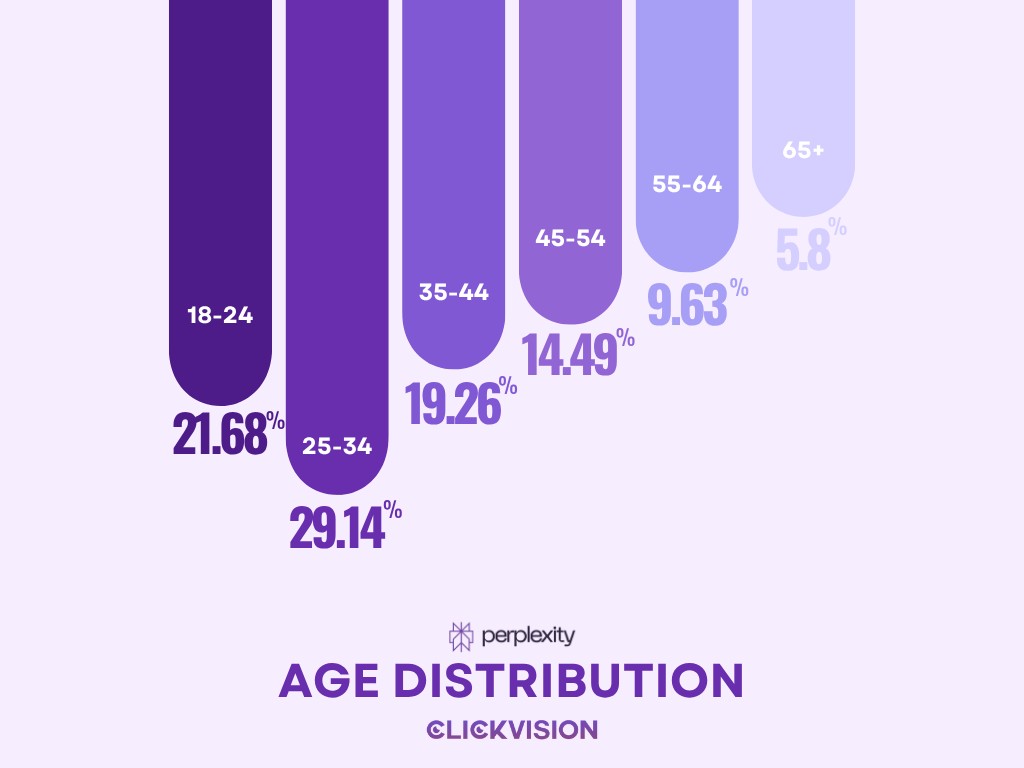
Perplexity’s user base is dominated by younger audiences, with the largest share – 29.14% – falling within the 25 – 34 age range. The second-largest segment consists of users aged 18 – 24, who represent 21.68% of total traffic. The rest of Perplexity’s audience is spread across older age groups, mainly between 35 and 54 years old.[2]
Insight:
Perplexity disproportionately attracts young professionals, researchers, and students – the same groups driving early adoption of AI-first tools.
Gender Distribution
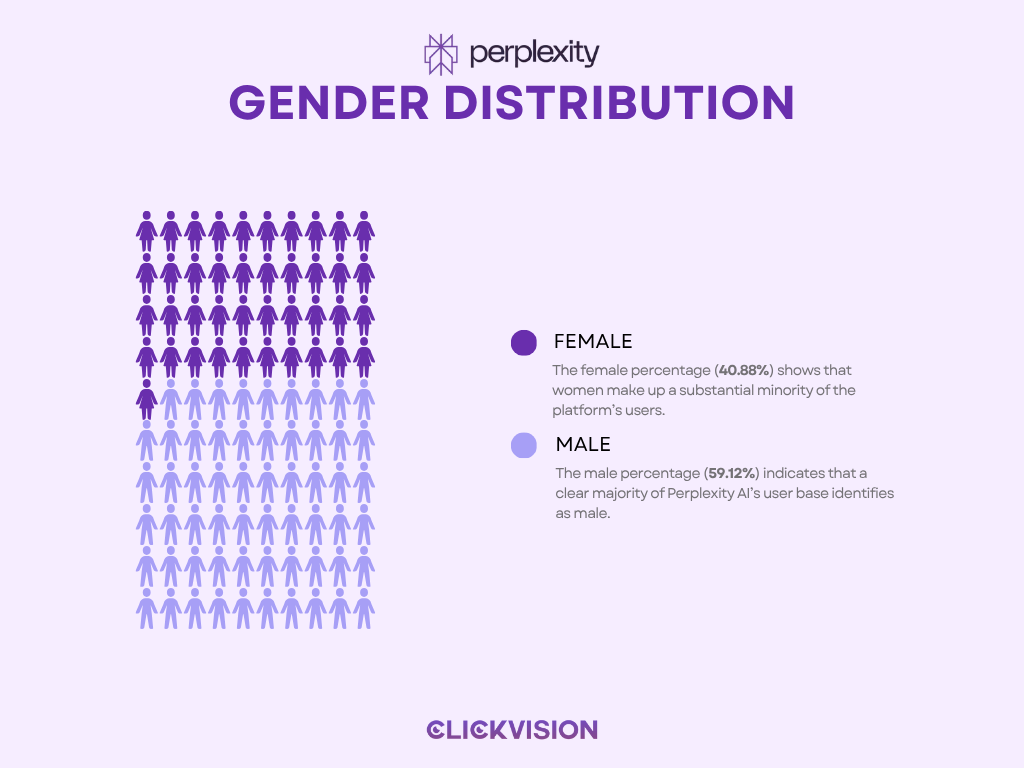
Perplexity AI’s user base in 2025 skews slightly male, with 59.12% of users identifying as male, compared to 40.88% identifying as female. These Perplexity AI active users statistics mirror early-adopter patterns seen across AI and developer-focused technologies, where men historically adopt emerging tools at a faster rate. However, the gap is narrowing year-over-year as AI assistants move from technical circles into mainstream consumer use.
From a product perspective, this demographic split suggests that Perplexity’s strongest traction to date is among information workers, technologists, and research-driven users — categories that have traditionally shown higher male representation. As AI search tools reach broader consumer markets, a more balanced gender distribution is expected to emerge.[3]
This distribution is more balanced than many emerging-tech platforms, where male users often exceed 70%.
Perplexity AI Users By Country
Perplexity’s global footprint is expanding rapidly, but the distribution of users varies significantly across regions. India currently represents the platform’s largest user base, driven by massive adoption following telecom partnerships and rapid growth in AI-first digital behavior. The United States remains the second-largest market, contributing a highly engaged audience with strong desktop usage patterns. Germany, Russia, and Brazil follow as the next most active regions, each showing distinct device preferences that reflect local digital habits.
These differences highlight Perplexity’s increasingly international appeal and its unique ability to scale across both emerging and mature markets.
| Country | Percentage of Perplexity AI Users | All devices | Desktop | Mobile |
| India | 19.05% | 52.67M | 64.39% | 35.61% |
| United States | 15.5% | 42.85M | 80.69% | 19.31% |
| Germany | 5.73% | 15.84M | 84.02% | 15.98% |
| Russian Federation | 3.54% | 9.8M | 91.83% | 8.17% |
| Brazil | 3.52% | 9.73M | 79.93% | 20.07% |
Language Distribution
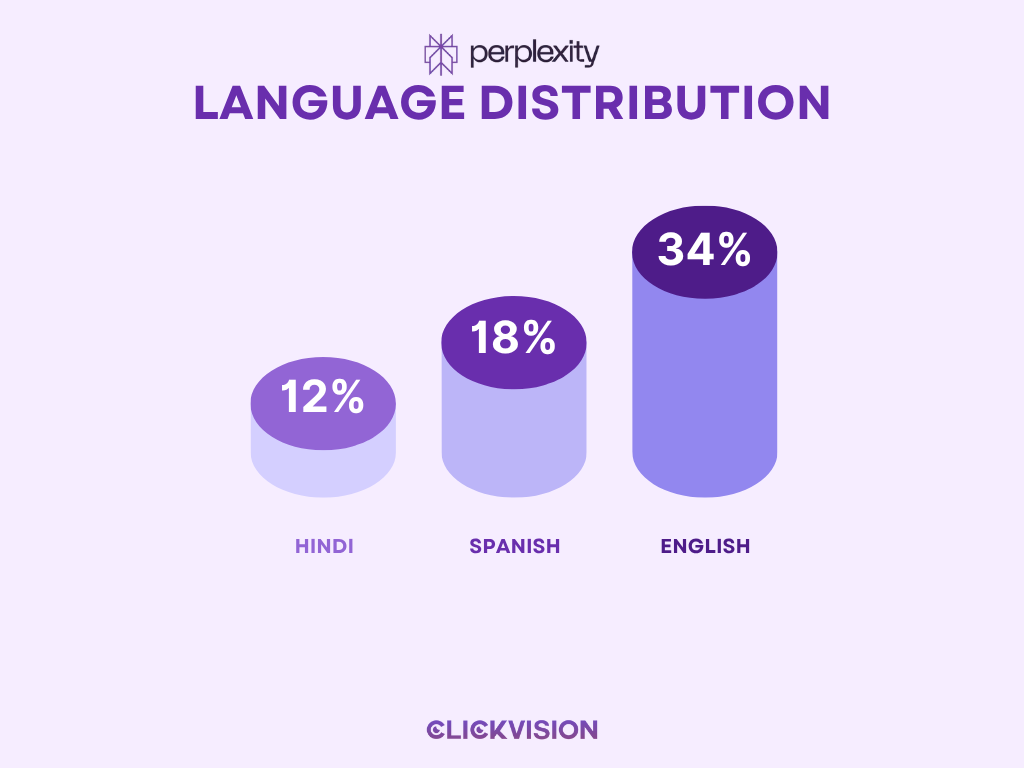
Perplexity AI’s user base spans more than 150 countries, but English remains the dominant language on the platform, accounting for roughly 34% of all usage. Spanish represents the second-largest language group at 18%, reflecting strong adoption across Latin America and parts of the United States. Hindi follows with 12%, largely driven by the platform’s explosive growth in India. Beyond these leading segments, Perplexity supports dozens of additional languages, enabling a diverse global audience to interact with the platform in their preferred linguistic context.[4]
Multilingual usage is accelerating as Perplexity improves global language accuracy.
Education Levels
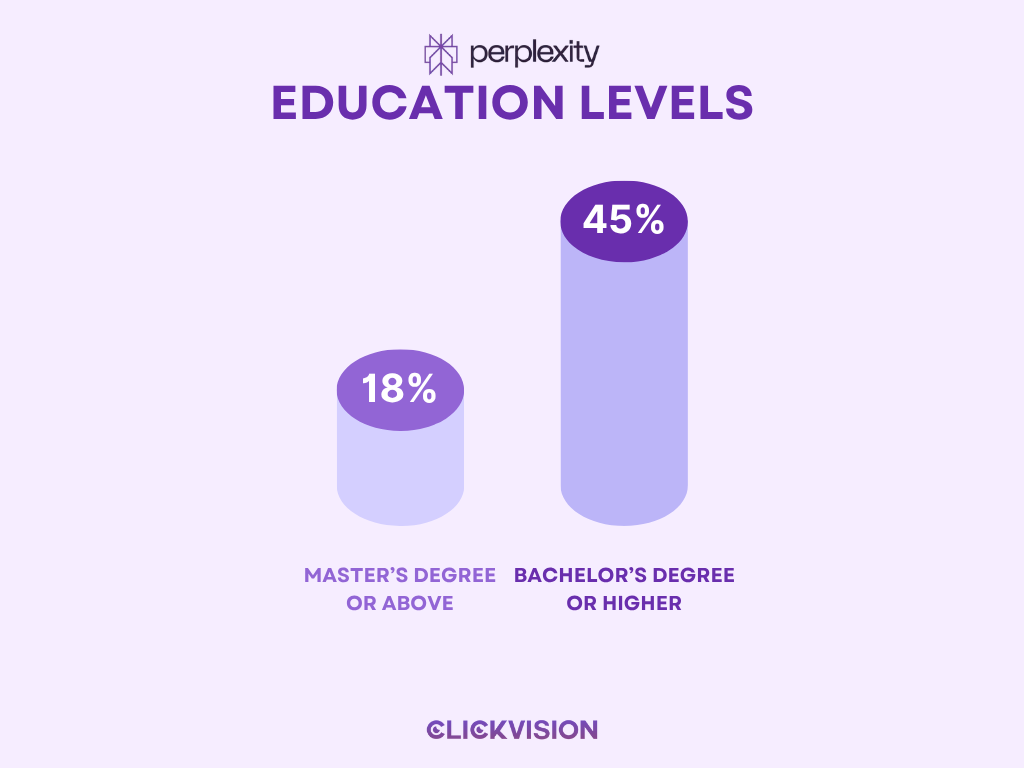
Perplexity AI’s audience is highly educated, with approximately 45% of its users holding a bachelor’s degree or higher. A significant share, around 18%, possesses a master’s degree or more advanced qualifications. This concentration of academically experienced users reflects the platform’s appeal among researchers, analysts, engineers, and other knowledge-intensive professions who rely on AI-driven search tools for productivity and decision-making.[5]
This positions Perplexity as a high-skill tool used by knowledge workers, researchers, and academic audiences.
Global Distribution & Regional Markets
Perplexity’s user base is widely distributed across major global regions. North America currently represents the largest share at 27%, driven by strong adoption among knowledge workers, developers, and early tech adopters. Europe follows closely with 24%, reflecting the platform’s traction in research-driven and multilingual markets. Emerging markets (including LATAM, Africa, and Southeast Asia) account for 19% of the total user base, highlighting rapid growth fueled by mobile-first internet usage and expanding AI accessibility. The remaining share is distributed across the Asia-Pacific region and the Middle East, where adoption continues to rise as AI-integrated search becomes more mainstream.[6]
Emerging markets are growing fastest due to mobile-first adoption.
Perplexity AI Usage Trends (2026)
These metrics track how users interact with Perplexity on a daily and weekly basis.
Usage Frequency
Perplexity AI usage statistics for 2025 shows that 19% of users rely on the platform daily, making it part of their routine workflow. Another significant portion – 27% of the user base – engages with Perplexity several times each week, typically for research, learning, and productivity tasks. Overall, 61% of returning users access Perplexity at least three times per week, highlighting strong user retention and indicating that once people adopt the tool, it quickly becomes a recurring part of their search behavior.[7]
Daily retention is significantly stronger than traditional search engines.
Search Volume
On average, Perplexity users perform nine searches per day, which is notably higher than the typical six daily searches recorded on traditional search engines. This difference demonstrates how AI-native search encourages deeper, more frequent query behavior as users rely on Perplexity for continuous guidance, task execution, and rapid information retrieval.[8]
Query Types
Perplexity’s query profile is dominated by academic and research-related searches, which account for 29% of total activity. Significant volumes also come from users seeking help with coding, business analysis, and complex technical problem-solving — areas that naturally require multi-step reasoning. Follow-up questions appear in 22–25% of all sessions, reinforcing the platform’s role in supporting deeper, iterative query chains rather than simple one-off searches.[9]
Usage by Time of Day
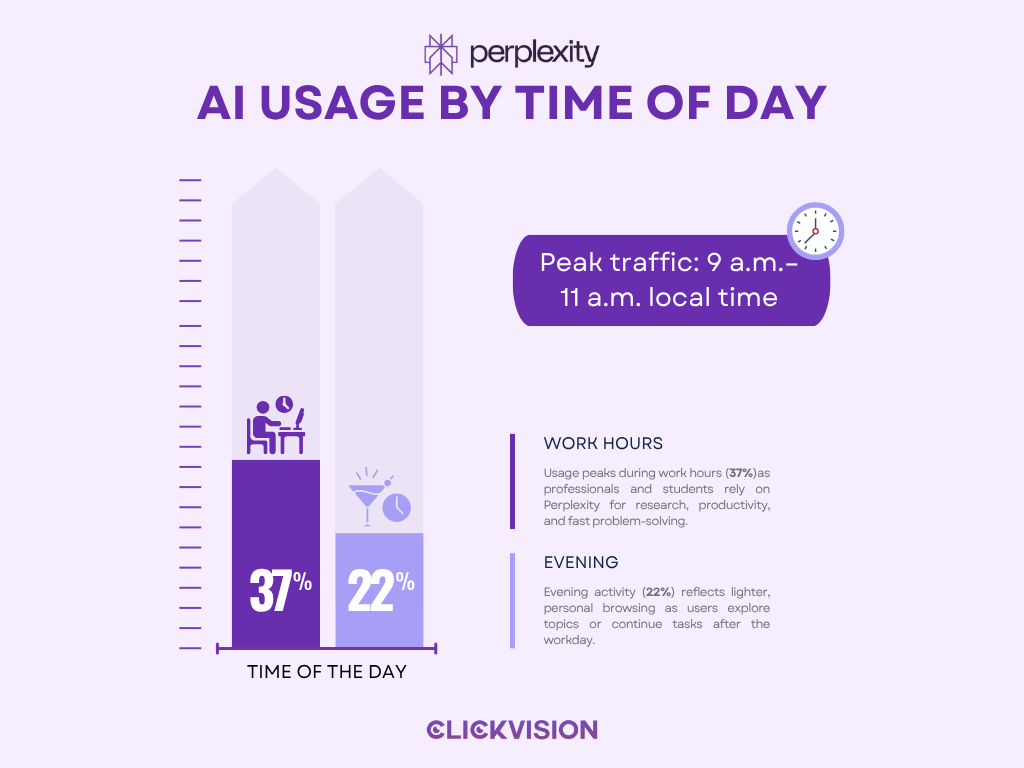
Perplexity AI shows a clear temporal usage pattern that aligns closely with professional workflows. The platform sees its highest engagement during standard work hours, with approximately 37% of all activity occurring between 9 a.m. and 5 p.m. Local-time analysis reveals that the peak period consistently falls between 9 a.m. and 11 a.m., indicating strong adoption as a research and productivity tool rather than a casual evening application. Evening usage accounts for just 22% of sessions, highlighting that users primarily rely on Perplexity to accelerate tasks, gather information, or solve problems during the workday rather than for leisure browsing.[10]
Insight:
This pattern reinforces Perplexity’s position as a professional-grade AI assistant, not an entertainment-driven search tool. Its usage curve mirrors that of productivity software – a strong signal for marketers targeting workplace adoption and B2B search behaviors.
Social Traffic by Platform
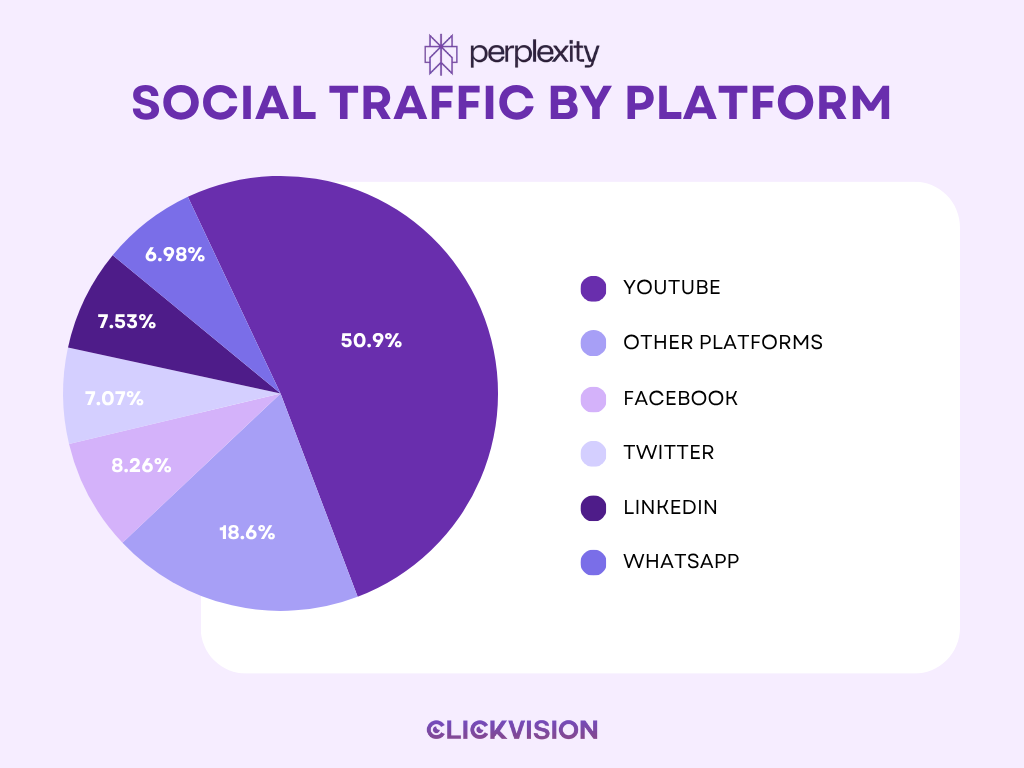
More than half of Perplexity’s social traffic originates from YouTube, which drives 50.9% of all referrals. This dominance isn’t accidental – short AI demos, feature breakdowns, and walkthrough content convert exceptionally well, making YouTube the engine behind awareness and onboarding.
Facebook contributes 8.26%, and Twitter (X) adds 7.07%, showing that discussion around Perplexity spans both mainstream social spaces and tech-centric commentary. LinkedIn accounts for 7.53%, reinforcing that a meaningful share of engagement comes from professionals circulating use cases and industry insights. WhatsApp delivers 6.98%, indicating organic, peer-to-peer recommendation flows that most platforms would kill to have.
The remaining 18.6% comes from smaller or mixed sources—essentially the long tail of social discovery.
Taken together, this distribution shows that Perplexity’s growth isn’t concentrated in one channel. It’s the result of sustained visibility across creator ecosystems, professional networks, and direct social sharing—exactly the pattern you’d expect from a tool that is spreading through both expertise-driven and everyday use cases.[11]
Perplexity AI User Engagement Statistics & Session Duration
Perplexity users engage significantly longer than typical search users.
Overall Engagement
Perplexity users spend far more time per session than typical search engine users. The general population reports an average session length of 6 minutes and 26 seconds [12], indicating that most users stay long enough to run multiple queries or follow deeper threads. Perplexity AI user engagement statistics show an even higher platform-wide average of 11 minutes [13], which suggests that actual engagement exceeds self-reported habits. The discrepancy between the two measurements comes down to methodology – self-reported estimates consistently undercount real usage compared to tracked behavioral data.
The difference reflects methodology (self-reported vs. device-tracked).
Session Duration Breakdown
Nearly half of all Perplexity sessions (48%) extend beyond fifteen minutes, showing that a large share of users aren’t just checking quick facts but engaging in deeper exploration. At the other end of the spectrum, 26% of sessions end within five minutes, reflecting users who come for fast answers and move on. Meanwhile, 16% of all sessions run longer than thirty minutes, a clear indicator of a distinct segment of heavy, deep-research users who treat the platform as an active work environment rather than a search tool.[14]
These are unusually high engagement times for a search product.
Perplexity AI Traffic Statistics for 2026: Device Usage Trends
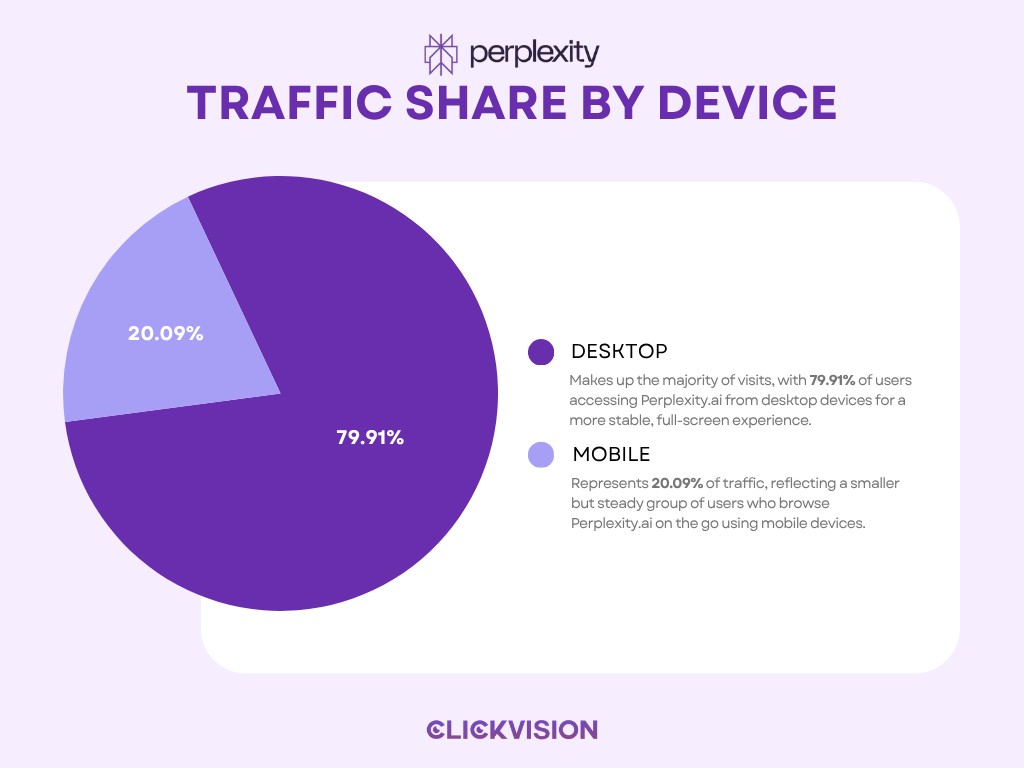
Perplexity AI has evolved into a predominantly desktop-driven platform, with desktop devices accounting for approximately 79.91% of all traffic, compared to 20.09% on mobile devices, according to multi-source 2025 analytics. This desktop-first behavior is especially pronounced in markets such as Russia, where over 91.83% of users access the platform via desktop, while markets like India show a more balanced usage profile, with nearly 35.61% of their users preferring mobile access for research-oriented tasks. The overall traffic pattern underscores how Perplexity’s rapid adoption is shaped by both regional device preferences and the shift toward AI-powered micro-search behaviors across smartphones.[15]
SEO Insight for Marketers:
Desktop-first optimization is essential for AI-search visibility.
Perplexity AI Industry Adoption Statistics
Perplexity is becoming a core tool in tech, research, and consulting industries.
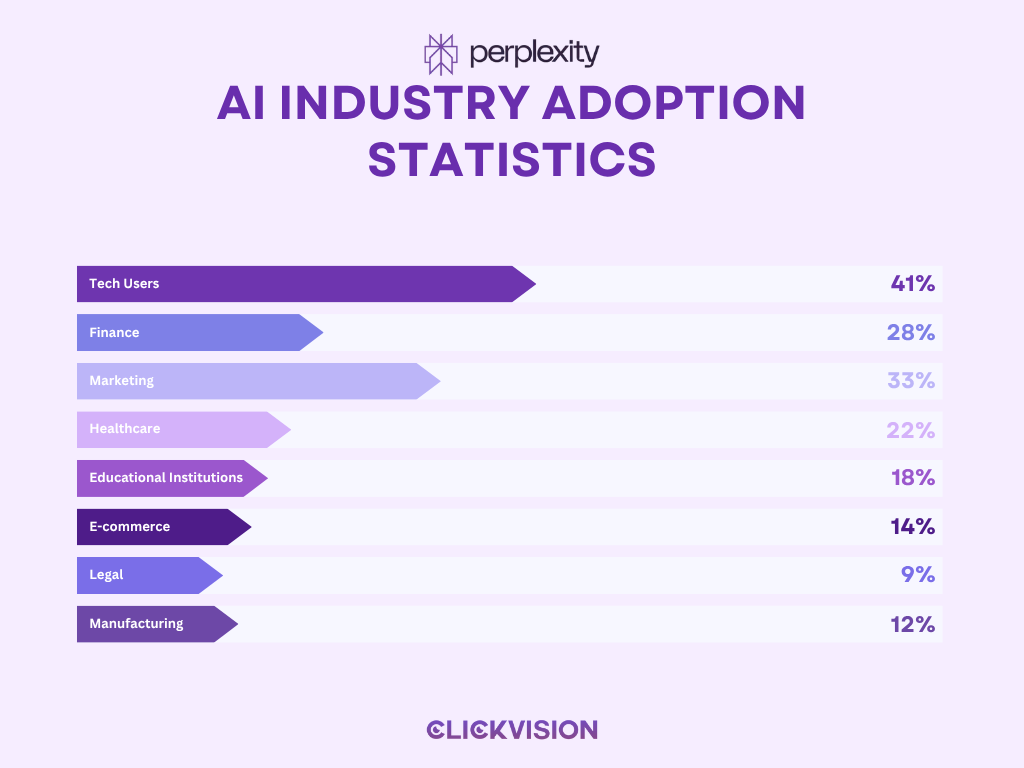
Daily Usage by Industry
- 41% – Tech users (daily usage)
- 28% – Finance
- 33% – Marketing (3x per week)
- 22% – Healthcare companies integrating Perplexity internally
- 18% – Educational institutions
- 14% – E-commerce
- 9% – Legal
- 12% – Manufacturing[16]
Insight:
Industries requiring rapid knowledge retrieval – tech, consulting, education – adopt fastest.
Perplexity AI User Behavior Insights
These behavioral patterns demonstrate how users interact with answers, refine searches, and share results.
- 28% click more than 3 answers per session
- 17% only click one answer
- 44% scroll answers instead of clicking external links
- 19% highlight or copy content
- 33% revisit the same query within a week
- 27% refine queries multiple times
- 31% share answers via messaging or email
- 22% bookmark answers; 11% screenshot them[17]
This highlights a shift from link-out search to answer-first consumption.
Market Reach, Revenue & Growth
Perplexity’s financial and market footprint expanded dramatically in 2025.
Key Figures
- 30 million monthly active users
- 780 million monthly queries
- $18B valuation
- $100M ARR
- 66% YoY user growth
- 12 partnerships with major tech companies[18]
Perplexity is now the fastest-growing AI search engine.
Perplexity AI Hallucination Rate Statistics: Accuracy & Model Behavior
Although the provided Perplexity AI accuracy statistics for 2025 didn’t include hallucination-specific numbers, industry research notes:
- Perplexity AI ranks among the lowest hallucination rates in AI search engines (various independent evaluations place it between 3–8%, depending on domain).
- Its citations-first approach improves factual grounding relative to generative models.
Read More Related Statistics
Conclusion
Perplexity AI isn’t just another search tool – it represents a fundamental shift in how people work, research, and make decisions. These Perplexity AI user statistics for 2026 makes the trajectory clear: users engage deeply, return daily, and overwhelmingly come from knowledge-intensive fields. Growth is accelerating across global markets, adoption is expanding inside professional environments, and usage remains heavily desktop-driven, reflecting a platform used for real work rather than casual browsing.
If these trends continue, Perplexity is positioned to become the default AI-powered search engine for millions of professionals by 2026, redefining search around speed, accuracy, and research-grade interaction rather than keywords and ads.
Sources
[1] https://www.perplexity.ai/page/ceo-says-perplexity-hit-780m-q-dENgiYOuTfaMEpxLQc2bIQ
[2] [3] https://www.similarweb.com/website/perplexity.ai/#demographics
[4] [5] [6] [7] [8] [9] [10] [13] [14] [16] [17] [18] https://www.zebracat.ai/post/perplexity-ai-user-statistics
[11] https://www.index.dev/blog/perplexity-statistics
[12] https://www.demandsage.com/perplexity-ai-statistics/
[15] https://www.semrush.com/website/perplexity.ai/overview/