In the vast world of digital marketing, there are never-ending innovations and changes. While you may have been an expert last year, this fast-paced environment is constantly developing. That’s why you should always keep up to date with the latest social media marketing statistics to stay on top of the game.
Continue reading to discover the latest social media growth statistics and how they can impact your business!

Source: campaign180.com
10 Fascinating Facts About Social Media Marketing Statistics
To start off, here are the 10 most fascinating facts about social media statistics for business:
- There are 4.89 billion social media users worldwide as of 2023
- The number of social media users is thought to reach up to 6 billion in 2027
- 84% of all online content is shared through Dark Social
- Social media ad spending is thought to reach $207.10 billion in 2023
- Only 19% of the US audience trusts social media advertising
- 89% of users have been influenced by a video to buy a product or service
- 29% of digital marketing experts plan on investing in Instagram over any other platform
- 86% of Americans believe that transparency on social media is of utmost importance
- Video is believed to be the most transparent content type
- 55% of consumers would boycott a brand they disagree with based on their values
Social Media Usage Statistics
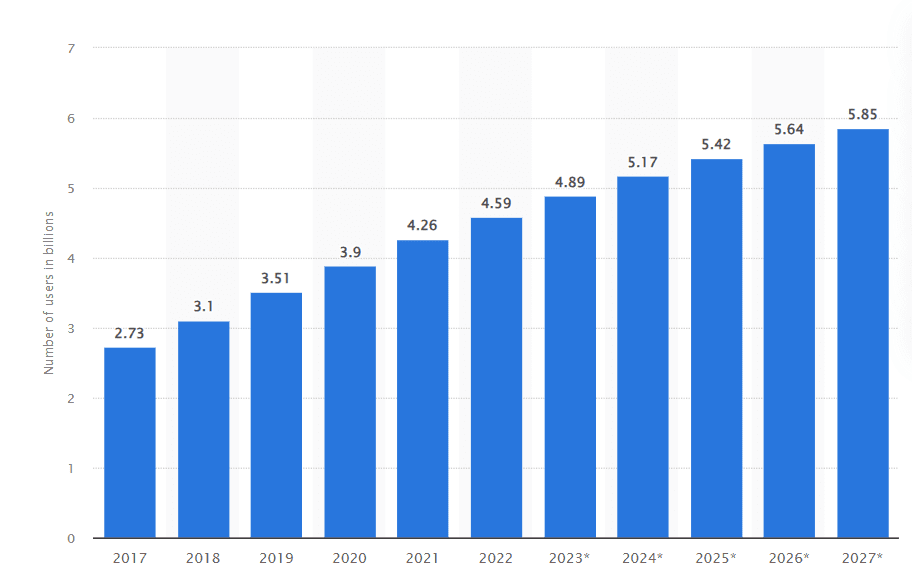
1. There are 4.89 billion social media users worldwide as of 2023
(Statista)
Social media users represent 59.9% of the global population. Furthermore, they include 92.7% of all internet users, making social media one of the most popular online activities. With many new users joining each second, these numbers are only expected to rise over time.
2. The number of social media users is thought to reach up to 6 billion in 2027
(Statista)
With 2.73 billion users in 2017, this number has gradually risen. With steady yet rapid growth, there were 3.1 billion users in 2018 and 3.5 billion in 2019. In 2020, these numbers reached 3.9 billion, with even a further rise in 2021 of 4.26 billion. Since the popularity of social media doesn’t seem to stop any time soon, statistics show that the numbers can reach up to 5.85 billion users in 2027.
Source: Statista
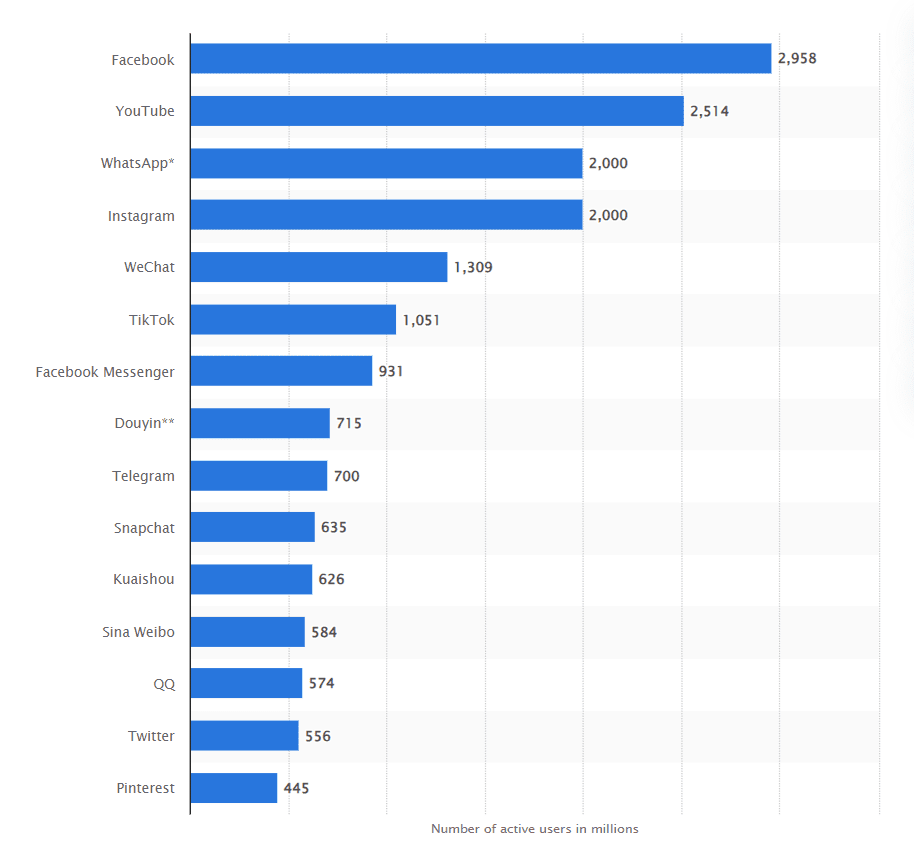
3. Facebook continues to be the number one most-used social media platform
(Statista)
Even though numerous prospering social media platforms are found online, Facebook is still the market leader in this branch. With 2,958 active monthly users, it surpasses the renowned YouTube with 2,514 monthly users. However, Facebook isn’t the only Meta platform that has shown success. WhatsApp and Instagram also have a dominant position on the market, both with 2,000 million active monthly users.
Source: Statista
4. Social media, websites, and email marketing are the leading digital marketing channels
(Hubspot)
According to global marketing professionals, social media is the number one marketing channel they leverage. With over 42% of digital marketers using it, it surpasses SEO websites at 33% and email marketing at 32%.
Other notable mentions are content marketing (29%), social media shopping tools (26%), search or display ads (26%), influencer marketing (26%), and virtual events or webinars (21%).
5. Facebook is the leading social media platform used by marketers
(Statista)
Statistics show that over 89% of social media marketers prefer Facebook as a channel to promote their business. Closely behind it is Instagram, with 80% of marketers using it to reach new customers.
6. Automation is most present in email marketing, social media marketing, and paid ads
(Statista)
Research shows that most marketers use automation during email marketing, with a total of 63%. Other marketing channels that use this process are social media with 50% and paid ads with 40%.
Social Media Marketing Engagement
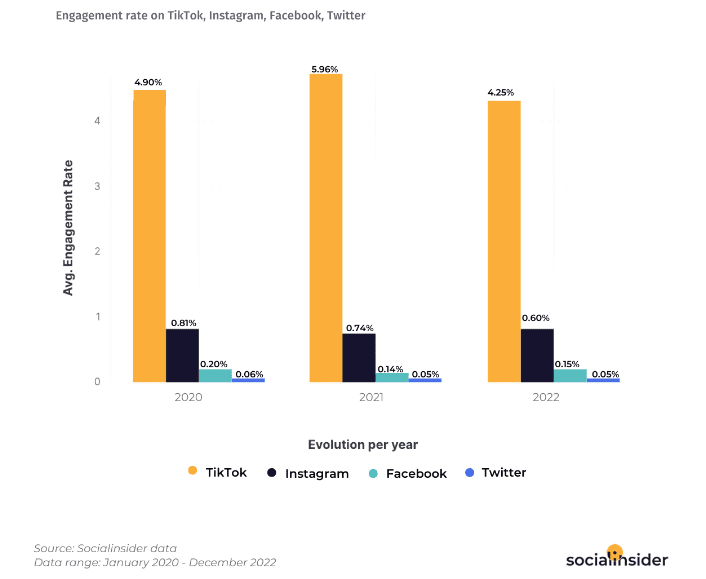
7. TikTok has the highest engagement rate per post among social media platforms
Even though engagement rates have dropped in 2023, Tiktok is still the leader in user engagement. With 4.25%, it’s far ahead of other social media platforms. While Instagram has a 0.60% engagement rate, Facebook has only 0.15%. The lowest ranking engagement is seen on Twitter, with only 0.05%.
Source: Socialinsider
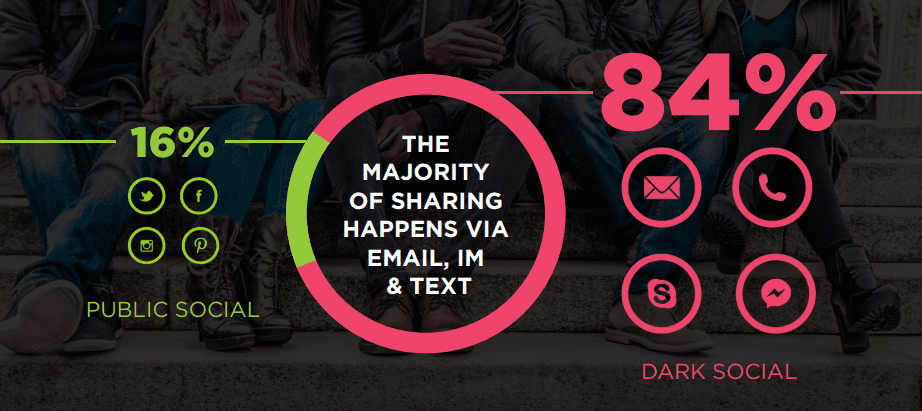
8. 84% of all online content is shared through Dark Social
While the first study in 2014 showed that 69% of the content is being shared through private messages, emails, and SMS, this number has risen to 84% in just a few years. Thus, only 16% of all shared media is done on public social platforms.
Source: RadiumOne
9. 51% of users are more likely to share video content
(Wyzowl)
With the rapid rise in visual content’s popularity, studies have shown that more than half of social media users are more likely to share video content. Social media posts containing images and text get only 26% share rates, while blog posts fall under 13%. Product pages are less likely to be shared, with only 8%.
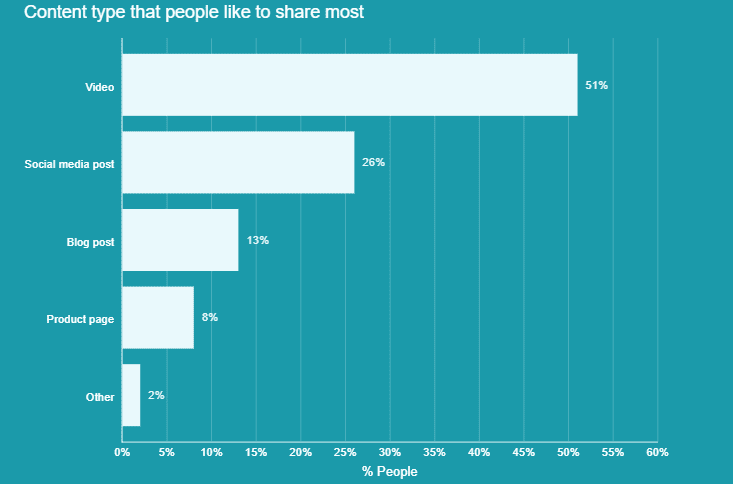
Source: Wyzowl
10. The number of internet users using ad blockers are rising
(Statista)
Research shows that more people rely on ad blockers to avoid noisy online ads. Based on a US study, here’s the percentage of people using this add-on:
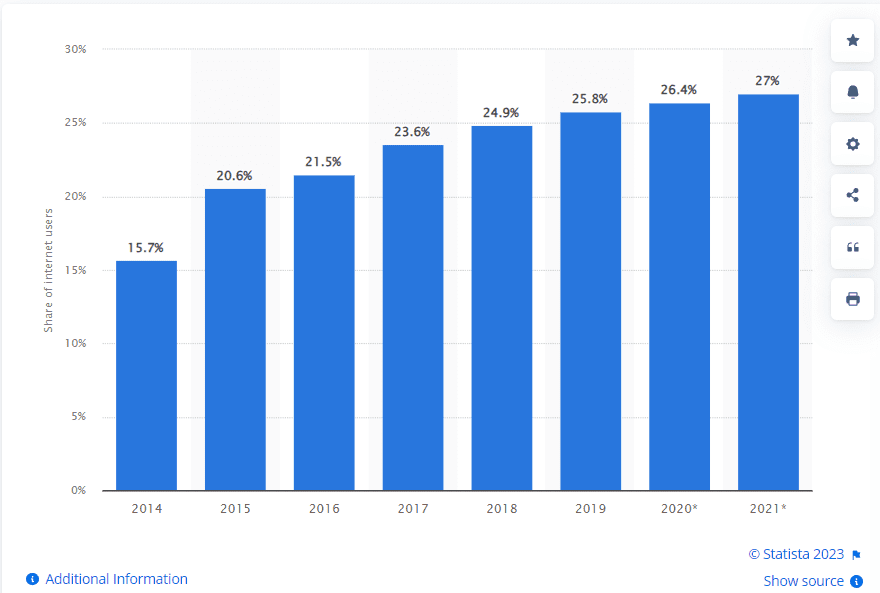
Source: Statista
11. 93% of businesses who started posting videos got new customers
(Animoto)
Research shows that almost every business that turned to video content was able to acquire new customers. As one of the most popular forms of content, it could easily catch the audience’s attention and gain their trust.
12. Social media ad spending is thought to reach $207.10 billion in 2023
(Statista)
With a total ad spending of $181 billion in 2021, more businesses than ever rely on social media ads to sell their products or services. Alongside the annual growth rate of 4.53% in the past years, these numbers are expected to climb to $358 billion in 2026.
While desktops used to be the primary devices digital marketing was focused on, now the ads target mobile phone users due to the rise in demand. Thus, it’s expected that only $41.18 billion will be spent on social media advertising on desktops and $220.5 on mobile phones.
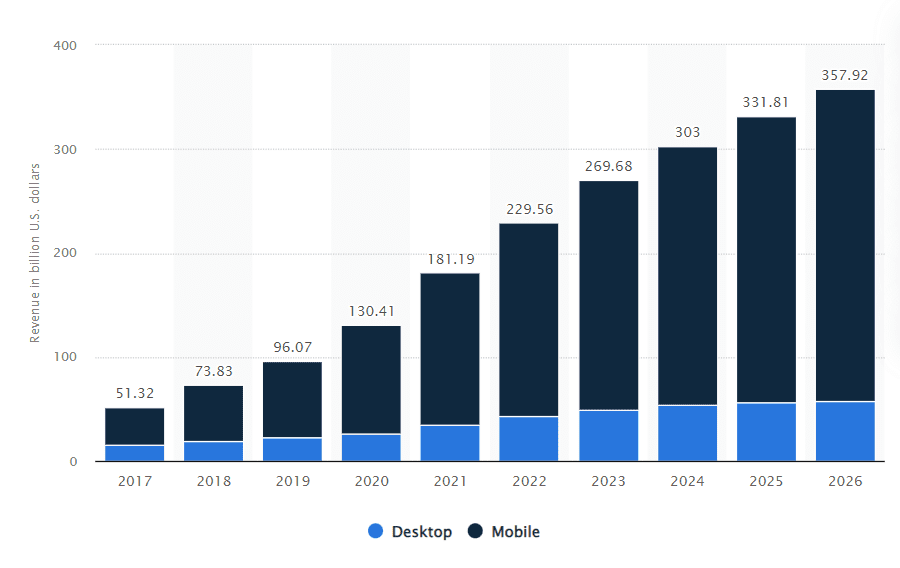
Source: Statista
13. Social media advertising is spending $38.84 per user intent in 2023
(Statista)
With the steady rise in average ad spending per user intent, the numbers rose from $4.24 for desktop and $10.11 for mobile in 2017 to $6.81 for desktop and $30.31 for mobile in 2022. Based on research, the average ad spending per user intent is predicted to be $33.96 for mobile and $6.92 for desktop by 2027.
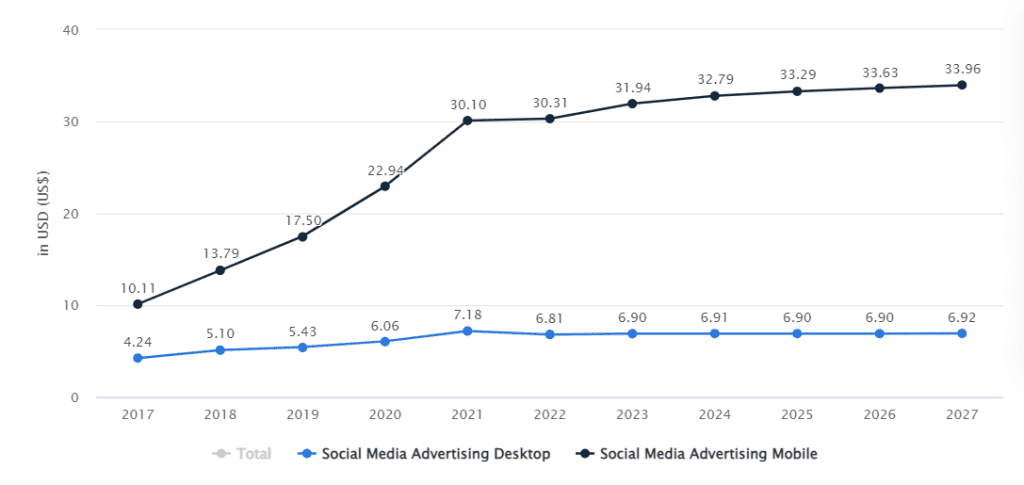
Source: Statista
How Social Media Affects Consumer Purchases
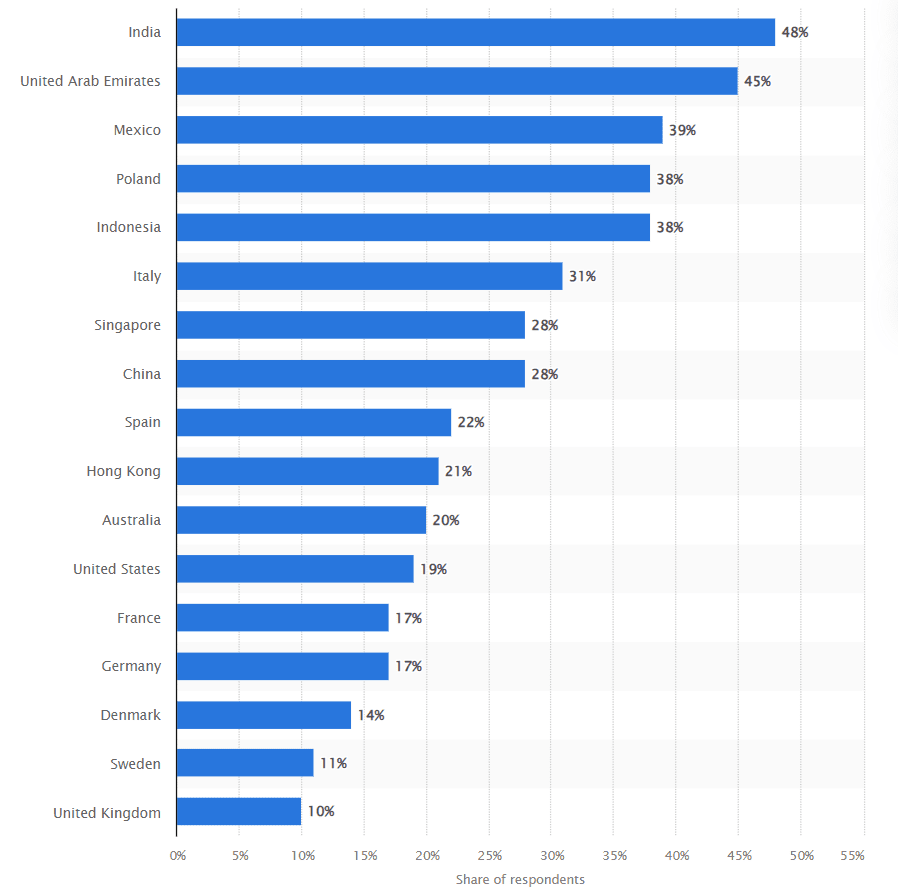
14. Only 19% of the US audience trusts social media advertising
(Statista)
A recent survey shows that trust in social media advertising varies based on the region. For example, the highest trust rates are seen in India and the United Arab Emirates, with 48% and 45%.
The lowest percentage of trust is seen in the United Kingdom and Sweden, with 10% and 11%. In France and Germany there’s 17%, in Singapore and China 28%, and in Poland and Indonesia 38%.
Source: Statista
15. 81% of marketing experts use pre-produced videos as a digital consumer engagement tactic
(Statista)
More than half of surveyed marketing experts incorporate pre-produced videos as part of their engagement tactics. While 50% add such videos to their email marketing strategies, the other half incorporate them on their landing pages. Furthermore, live, brand, and short-form videos are the most used video formats.
With a mobile-friendly strategy, this content has proven more effective when compared to written text. And with the attention-grabbing characteristic of short-form videos, marketers claim they see the best ROI when using them.
16. 47% of US consumers have purchased a product or service through social media
(Mintel)
While almost half of the US consumers have bought a product or service through social media, only 39% are willing to do so again. The biggest fear people have when purchasing through such platforms is the security of their personal information. Thus, 34% are willing to try shopping through these channels if they know how their information is kept and used.
17. 24% of users between 18-64 use social media to research products
(Statista)
While 54% of US consumers have researched the desired media through search engines, 24% heavily rely on social media platforms to gather the needed information. Even though social media does influence the buyer’s choice, users are also driven by customer reviews and online influencers.
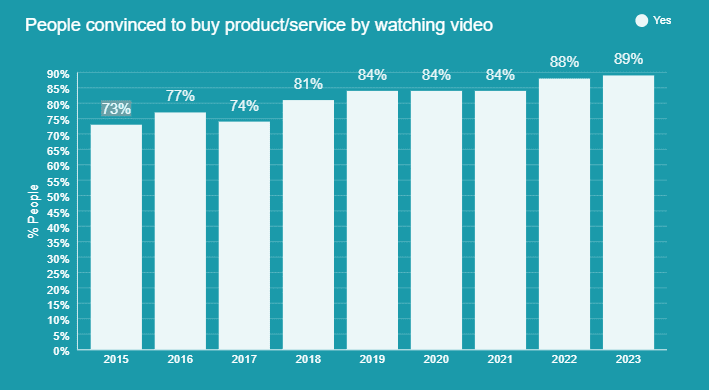
18. 89% of users have been influenced by a video to buy a product or service
(Wyzowl)
The influence video content has on people’s buying preferences has increased in the past years. While 73% of users claimed that they bought a service or product after watching a video in 2015, these numbers have risen to 89% in 2023.
Even though the numbers were stagnant from 2019 to 2021, they remained up to 84%.
Source: Wyzowl
19. 21% of users between the ages of 18 and 54 have bought an influencer-recommended product
(Hubspot)
While 31% of all social media users rely on influencers to discover new products, only 21% make a purchase. However, there’s a slight difference when the same study was done on Gen Z consumers. Out of this group, 43% prefer influencers for product discovery, while 32% actually purchased a product.
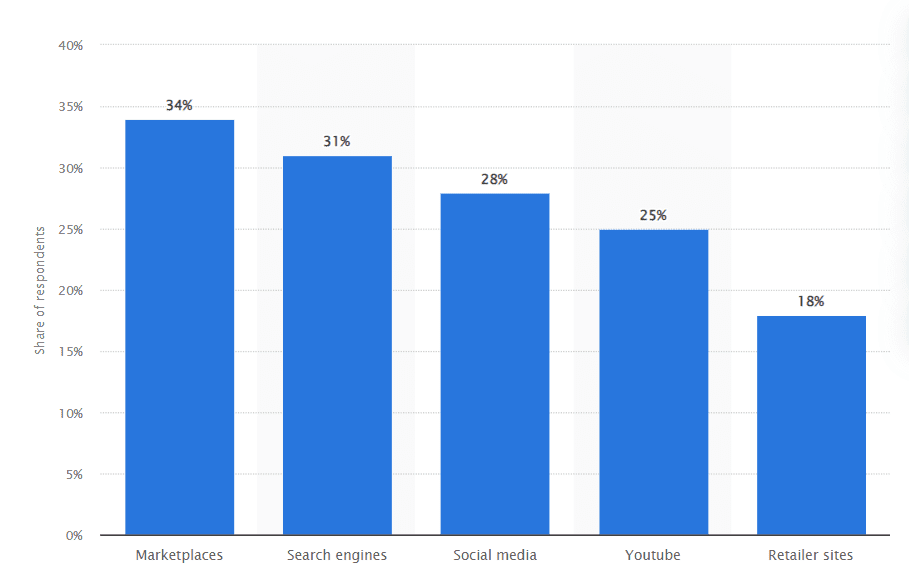
20. Marketplaces, search engines, and social media are the leading sources of inspiration for online shoppers
(Statista)
Statistics show that 34% of online shoppers choose marketplaces as their primary source of inspiration. Right below are search engines, with 31%. As for social media, it stands firmly in third place with 28%, while YouTube has 25%. Lastly, retail sites are on a lower scale, accumulating only 18% of all online shoppers.
Source: Statista
Social Media Marketing Effectiveness & ROI
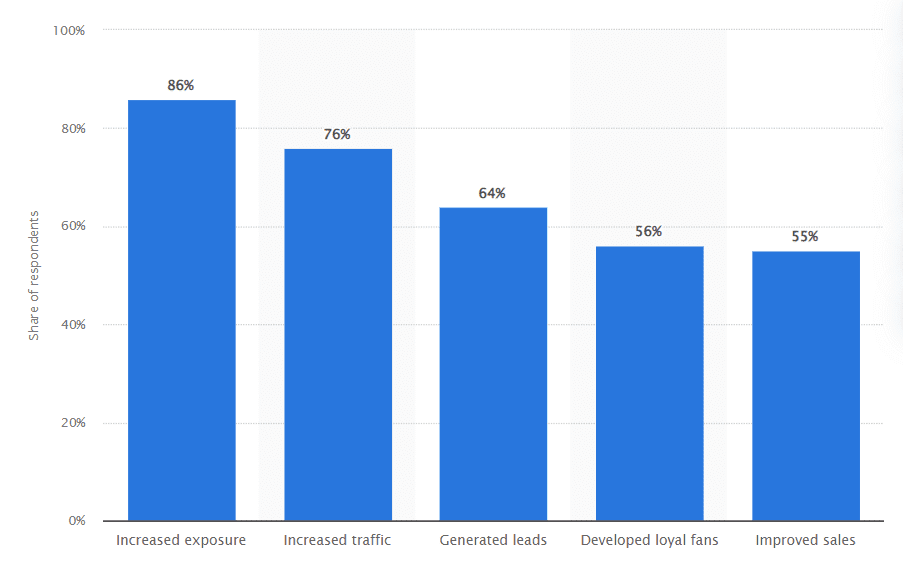
21. Exposure, traffic, and lead generation are the leading benefits of using social media for marketing purposes worldwide
(Statista)
Recent studies show that using social media for marketing strategies increases exposure and traffic. The first stands proud with 86%, while the latter follows closely with 76%. Lead generation is another important aspect of any marketing campaign, sitting in third place with 64%. Other benefits are developing a loyal fanbase (56%) and improved sales (55%).
Source: Statista
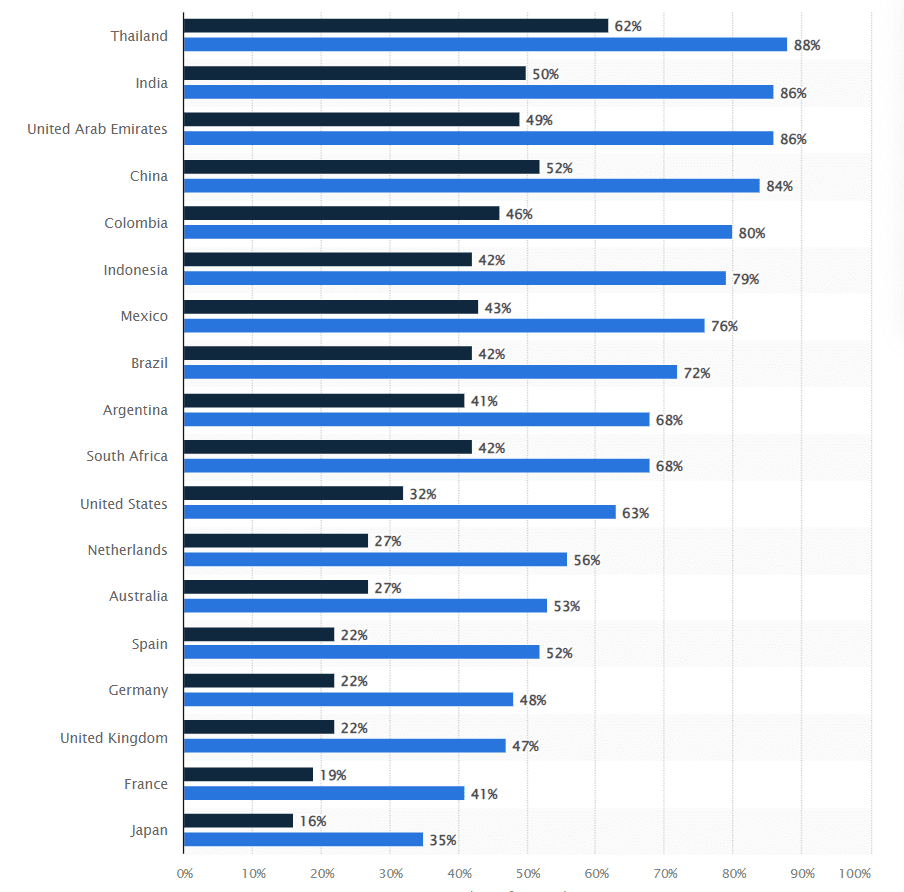
22. Thailand, India, and the United Arab Emirates ranked highest based on the percentage of online consumers buying from social networks in 2022
(Statista)
In 2022, Thailand had the highest shares of social commerce buyers internationally. It reached 88% of overall social commerce, while 62% transacted on the designated platform. Following closely behind are India and the United Arab Emirates, both with 86%. However, India was ahead regarding on-platform purchases, leading with 50% against UAE’s 49%.
High percentages were also seen in China (84%), Colombia (80%), Indonesia (79%), and Mexico (76%). On the middle scale is Brazil with 72%, Argentina and South Africa with 68%, the US with 63%, the Netherlands with 56%, Australia with 53%, and Spain with 52%. On the lower scale were Germany (48%), the UK (47%), France (41%), and Japan (35%).
Source: Statista
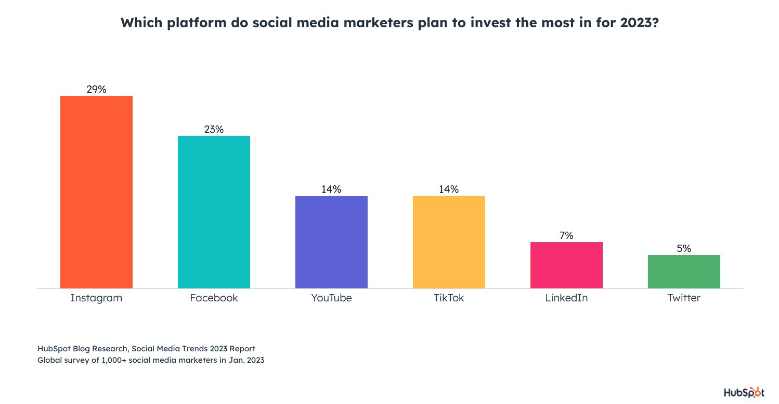
23. 29% of digital marketing experts plan on investing in Instagram over any other platform
(HubSpot)
With the biggest potential growth, Instagram is the most sought-after social media platform for marketers to invest in. With a 29% interest rate, it is ranked higher than the most used social media platform, Facebook, at 23%. In third and fourth place are Youtube and TikTok, with 14% interest rates. LinkedIn is second to last with 7%, saving the last place for Twitter, with only 5%.
Source: Hubspot
24. Instagram has the largest ROI, according to digital marketing experts worldwide
(HubSpot)
According to a HubSpot survey, most marketing experts believe that Instagram offers the highest return on investment. With 25%, it stands higher than Facebook, which has a 23% ROI. While YouTube has 14%, Tiktok comes in fourth with 12%. The two social media platforms thought to have the lowest ROI are LinkedIn and Twitter, with 11% and 6%.
25. Facebook has the largest ROI for B2B marketers worldwide
(Statista)
B2B marketers believe that Facebook as a social media platform has the highest return on investment, with an 18% share of respondents. Right below are Instagram and TikTok, both with 15%. Youtube and LinkedIn come in last with only 14%.
What Social Media Users Expect from Brands
26. Websites and e-commerce sites can benefit from social media platforms
(Statista)
Social media platforms have several factors that drive online shoppers worldwide. First, they offer a space where businesses can announce deals and discounts, which 36% of respondents found most valuable. Furthermore, they’re open to exclusive offers, and the audience can share their satisfaction with the product or service. With the numerous endorsement and influencer opportunities, gaining the audience’s trust and redirecting them to the website is easier.
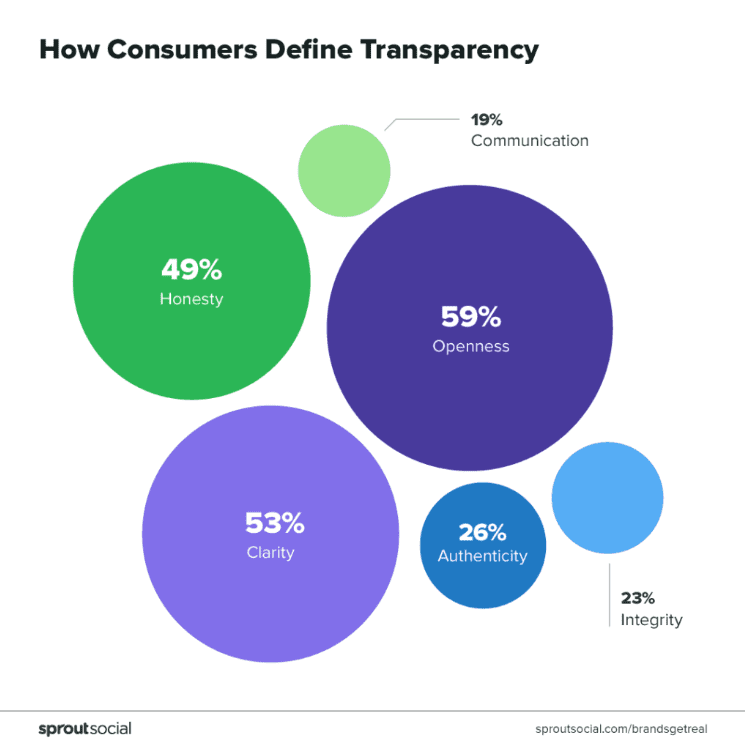
27. 86% of Americans believe that transparency on social media is of utmost importance
Since most US social media trust brands with higher transparency, there are different ways they define it. While 59% believe it’s based on the company’s openness, 53% base their trust on clarity. Another key factor is honesty, with 49%. Less important factors that also play an important role are authenticity (26%), integrity (23%), and communication (19%).
Source: SproutSocial
28. Video is believed to be the most transparent content type
67% of people agree that video is the most transparent type of content, of which 43% specifically allude to live videos. There’s a huge gap between this content type and others since only 23% think the written text has transparency. Photos and GIFs hold an even lower percentage, with only 6% and 4%.
29. 55% of consumers would boycott a brand they disagree with based on their values
Studies show that more than half of consumers are willing to discontinue shopping or boycott a brand based on their values and beliefs. This is especially risky if a brand chooses to support a specific public issue with which the audience doesn’t align their views. Even 34% of consumers are willing to spend less on brands they disagree with.
30. Consumers expect brands to express their views and transparency on social media, TV or radio ads, and media interviews
The number one place where people expect brands to show transparency is on their social media profiles. This allows them to connect with the audience and establish a personal connection. Right below social media, people also respect honesty in TV and radio ads. The same can be expected in different kinds of media interviews.
Bottom Line
After discovering how many social media platforms are there and what percentage of people use social media, it’s safe to say that the digital marketing field is experiencing fast and steady growth. With these recent social media marketing statistics, it’s obvious that most people rely on these platforms for various information. Thus, brands can use the opportunity and invest in a strategy that will only benefit them in the end.
