As the internet has changed many aspects of our lives, it has also revolutionized the way we shop and sell. So what do the latest eCommerce statistics hide about the influence of the digital market space on overall retail sales?
If you are curious to find out more about the growth of eCommerce, its global reach, and reveal the preferences of digital shoppers, you are in the right place.
Let’s analyze the latest eCommerce insights so you can have a better and broader understanding of the field.

Source: medradigital.com
Top 10 Most Interesting Statistics About eCommerce
- eCommerce in 2021 accounted for 18.8% of all retail sales in the world
- There were $5.211 trillion in eCommerce sales in 2021
- Asia had the highest eCommerce revenue in the world in 2022, counting $1.802 trillion
- In 2022, 268.2 million people purchased something online in the US
- By monthly traffic, Amazon is the most visited marketplace in the world, with 5.69 trillion visits
- In the US, the male population made up 53.1% of online shoppers
- 35% of global online purchases were done by using online marketplaces
- Every third digital shopper chooses the leading marketplace in the region as a source to search for products
- The average number of units bought per online order in 2022 was 2.98
- Americans spent an average of $112.29 per mobile order in the second quarter of 2022
General eCommerce Statistics
1. eCommerce in 2021 accounted for 18.8% of all retail sales in the world
(Statista)
eCommerce has a greater share of the total retail sales each year. The biggest increase was noticed when the COVID-19 pandemic hit, when it grew from 13.8% in 2019 to 17.8% in 2020. In 2021, eCommerce reached almost 19% of global retail sales.
Considering the steady increase, the predictions are that eCommerce will account for 24% of worldwide retail sales in 2026.
2. There were $5.211 trillion in eCommerce sales in 2021
(Statista)
As eCommerce sales grow, so does the amount of money people spend online. The eCommerce market has noticed a year-over-year increase of almost 1 trillion from 2020 to 2021.
Since 2014, the worth of retail eCommerce sales in the world has grown by 390%.
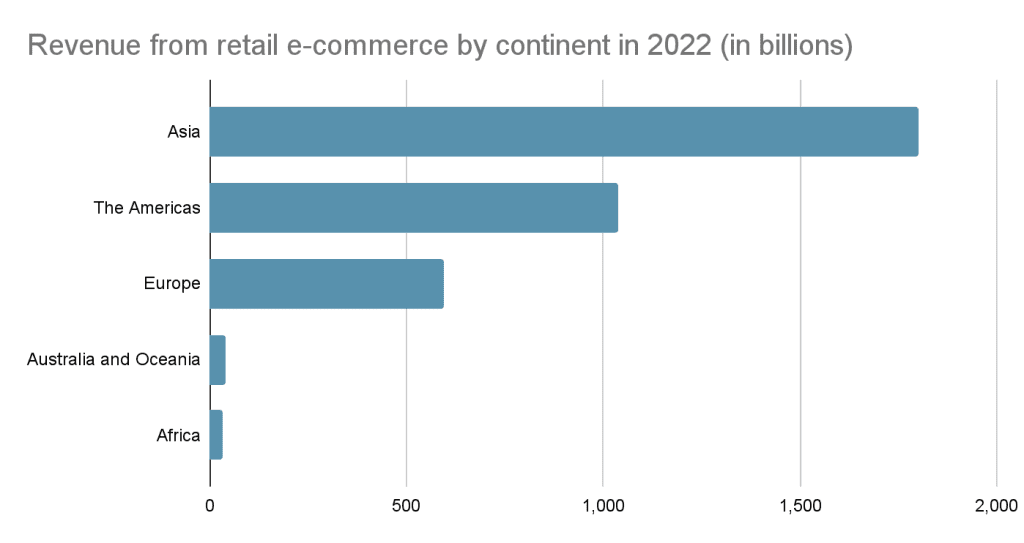
3. Asia had the highest eCommerce revenue in the world in 2022, counting $1.802 trillion
(Statista)
The eCommerce statistics show that Asia was the world leader in revenue collected in 2022. It has created almost $8 billion more than the world’s second-ranked, The Americas.
Source: Statista.com
4. The Asia-Pacific region is also the leader in global B2B eCommerce distribution, with a GMV of 78.1%
(Statista)
The Asia-Pacific region holds almost 80% of the global B2B eCommerce gross merchandise volume in 2021. The region has held a steady GMV since 2016.
Far behind is North America with 15%, then comes Europe and the rest of the world with 6.3% and 0.2% share, respectively.
5. The global B2C eCommerce market is expected to reach $6.5 trillion in 2023
The B2C eCommerce market will grow as the number of internet users increases. Between 2022 and 2026, experts estimate it will record a 9.1% compound annual growth rate (CAGR).
Furthermore, it is expected for the B2C eCommerce market to reach $8.3 trillion in 2026.
6. In 2022, the global B2B eCommerce market value was $7.08 trillion
The expected CAGR of the B2B eCommerce market between 2023 and 2030 is 18%.
The estimations are that in 2026, the B2B eCommerce market will be $13.73 trillion. 2030 is estimated to double the numbers from 2026, valuing the B2B eCommerce market at $26.59 trillion.
7. In 2022, 268.2 million people purchased something online in the US
(Statista)
Year after year, the number of digital buyers in the US has been increasing at a steady rate since 2018, when there were only 234.82 million eCommerce users. The 2021/22 year-over-year growth was 3.7 million users.
8. The largest US eCommerce market segment is food and personal care, accounting for 27.3% of the overall revenue
Almost every third eCommerce sale is connected with food and personal care in the US. Other market segments with significant influence on the US eCommerce revenue are:
- Toys, hobbies, and DIY – 25.6%
- Fashion – 20.5%
- Furniture and appliances – 13.4%
- Electronics and media – 13.2%
eCommerce Market Leaders
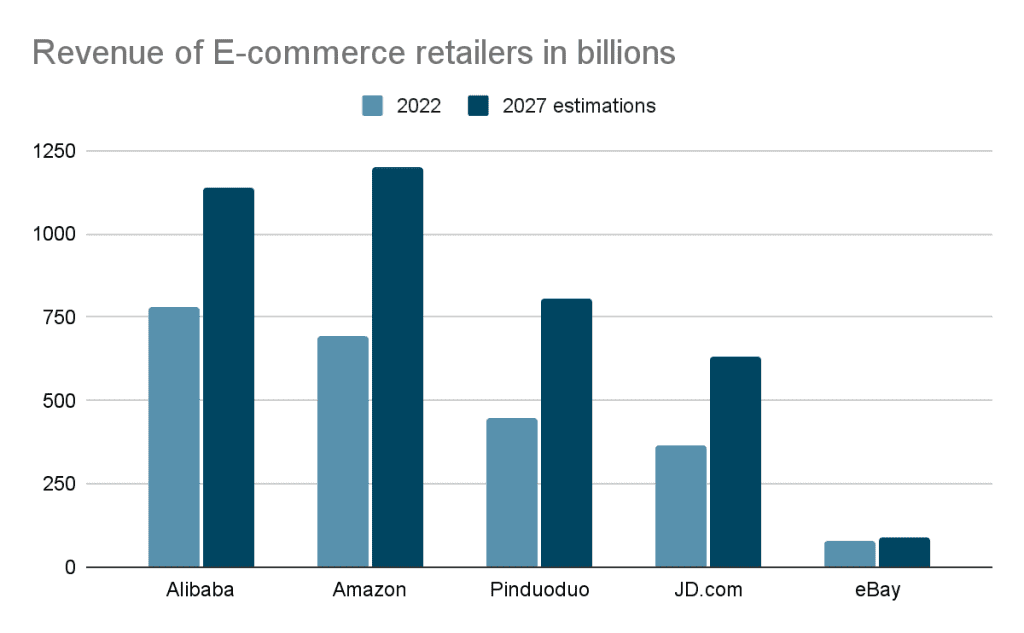
9. Alibaba was the leading eCommerce retailer in the world in 2022, with annual revenue of $780.7 billion
(Statista)
According to the 2022 eCommerce statistics, Alibaba is the leading eCommerce retailer in generating revenue.
However, the estimations are that Amazon will take first place in 2027. Amazon is predicted to have $1.2 trillion, while Alibaba will have online sales worth $1.137 trillion.
Source: Statista.com
10. Taobao was the most popular online marketplace in 2021, with a gross merchandise value of $711 billion
(Statista)
Considering the gross merchandise value of online marketplaces, Taobao takes the lead, with $39 billion more than the second-ranked Tmall. In third place in 2021 was Amazon, with $390 billion. The fourth and fifth positions were taken by JD.com and eBay with $244 and $88 billion, respectively.
11. By monthly traffic, Amazon is the most visited marketplace in the world, with 5.69 trillion visits
(Statista)
With almost 5.7 billion monthly visits, Amazon was the most popular online marketplace worldwide in 2022. eBay is second on the list with its 2.98 billion monthly visits.
Other platforms like Shopee, Rakuten, AliExpress and Walmart have between 510 million and 630 million visits in one month.
12. In 2022, 46.3% of the overall retail sales in China were online
(Statista)
It is estimated that almost half of the retail sales in China in 2022 were made online. Other countries with the highest percentage of retail sales being conducted online are:
- United Kingdom – 36.3%
- South Korea – 32.2%
- Denmark – 20.2%
- Indonesia –20.2%
- Norway – 19.4%
13. The estimations are that Singapore had a 36% growth in eCommerce sales in 2022
(Statista)
The top five countries that were expected to report the highest eCommerce sales growth in 2022 were Singapore, Indonesia, the Philippines, India, and Argentina.
Source: Statista.com
eCommerce Shoppers Statistics
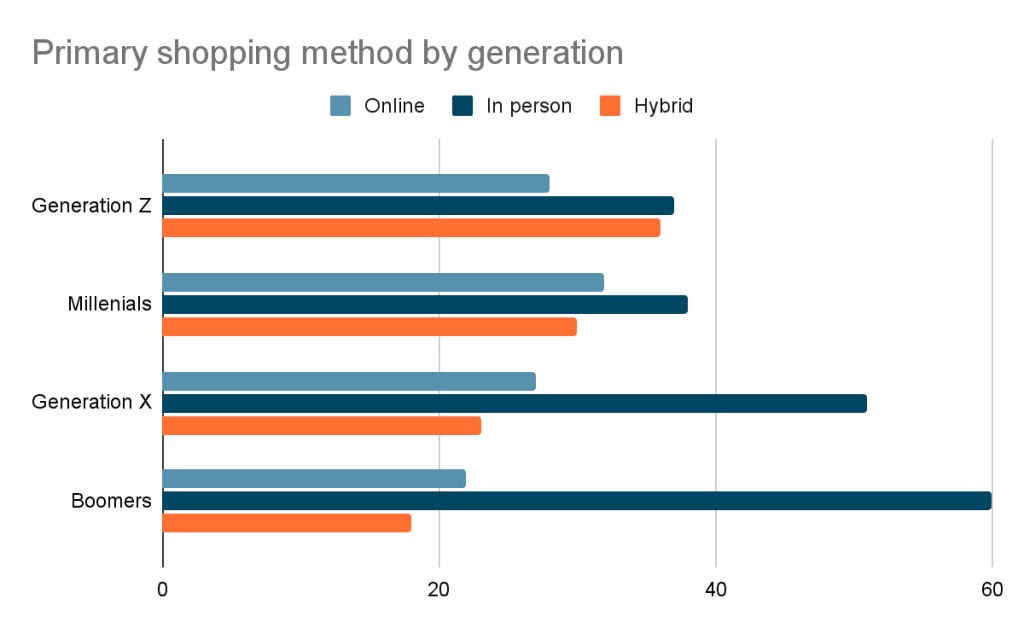
14. Millennials have the highest percentage of representatives choosing eCommerce as their primary shopping method
(Statista)
32% of millennials consider eCommerce as their primary shopping method. As for the other generations, 28% of Generation Z, 27% of Generation X and 22% of Boomers prefer online shopping.
Source: Statista.com
15. In the US, the male population made up 53.1% of online shoppers
(Statista)
As of March 2023, there were more male online shoppers than women. However, the difference wasn’t drastic. Women made up 46.9%, while men were 53.1% of the eCommerce shoppers in the US.
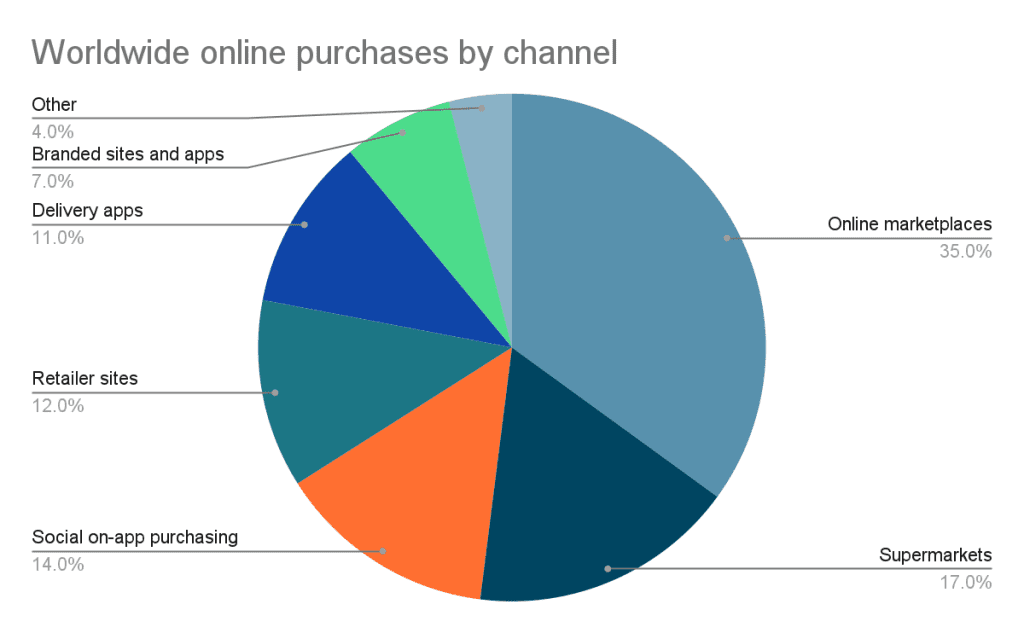
16. 35% of global online purchases were done by using online marketplaces
(Statista)
Online marketplaces are the most used channels for online purchases. Every third online order is done on leading marketplaces like eBay, JD.com, and Alibaba.
Other channels chosen by digital shoppers in 2022 were supermarkets, social on-app purchasing, retailer sites, delivery apps, and branded sites and apps.
Source: Statista.com
17. Every third digital shopper chooses the leading marketplace in the region for searching products
(Statista)
The first place 36% of online shoppers look for a product is the leading market in the region. Other popular product searching sources are search engines, which are chosen by three of 10 shoppers.
23% use social media sites to find the product they need, and 21% browse through other marketplaces. Surprisingly, only 18% look for the things they need directly on retailer sites.
18. For 45% of consumers, the flexibility and ability to shop anytime is the main reason they like eCommerce
(Statista)
Almost half of the customers prefer to shop online because it is flexible. Other reasons why people like to purchase something online are:
- Better prices – 37%
- Not required to go in person – 36%
- More types of products are available – 34%
- Avoiding crowds – 32%
- Easy to find what they need – 26%
- Ability to read customer reviews and do research about the products – 25%
- Ability to shop globally – 22%
19. The average number of units bought per online order in 2022 was 2.98
(Statista)
The average number of products bought in one eCommerce purchase in 2022 ranged between 2.86 and 3.16. As per the eCommerce statistics, October had the least, while April recorded the most items purchased per order.
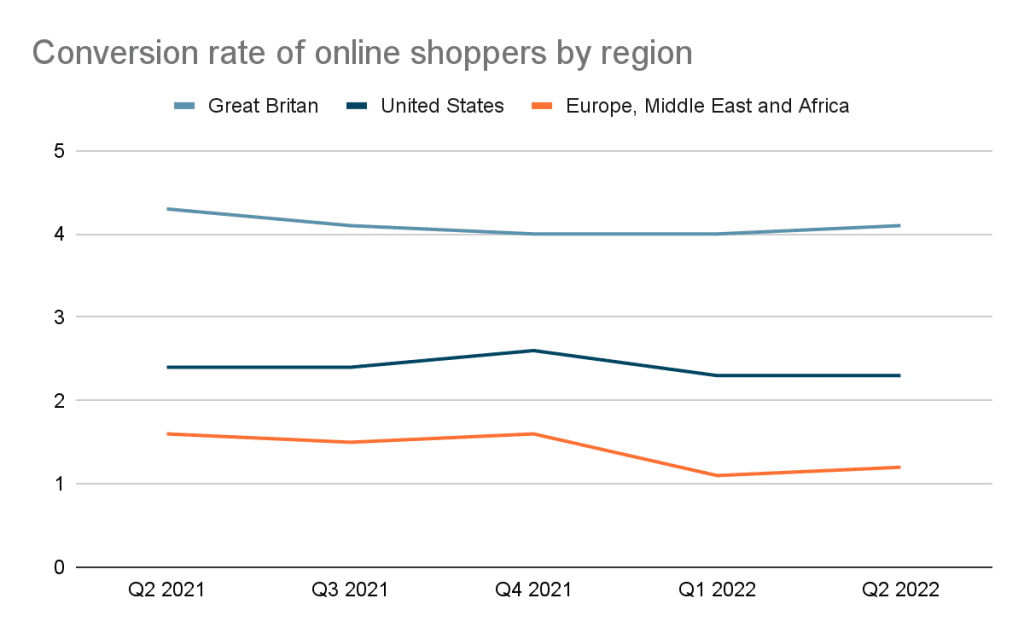
20. Great Britain has the highest conversion rate in the world, with 4% of the eCommerce visits resulting in purchases
(Statista)
In a period of one year between the second quarters of 2021 and 2022, Great Britain had the highest conversion rate of online shoppers, ranging from 4% to 4.3%. During the same period, around 2.4% of the online visits to a website were converted to purchases in the US.
Source: Statista.com
21. The cruise and ferry industry, in 2022, had a 98% cart abandonment rate
(Statista)
On a global scale, the cruise and ferry industry is struggling with the highest cart abandonment rate. Other industries where nine out of 10 carts are abandoned are mobile providers and airlines. Luxury and fashion had an 87% cart abandonment rate.
On the other hand, consumer electronics and groceries were categories where only half of the customers didn’t finish their orders.
22. Shopping carts from mobile devices have roughly 10% higher abandonment rates than desktop orders
(Statista)
From the second quarter of 2021 to the same time the following year, digital shoppers from mobile devices had a higher abandonment rate than the ones shopping from desktop devices.
On average, the shopping cart abandonment rate in the US was 83.6% for mobile phones and 71.8% for desktop shoppers.
23. Marketplaces are the leading source of inspiration for 34% of digital shoppers
(Statista)
Marketplaces inspire every third online shopper to purchase something online. The survey respondents also mentioned the following sources of inspiration in 2022:
- Search engines – 31%
- Social media – 28%
- YouTube – 25%
- Retailer sites – 18%
M-Commerce Statistics
24. 38% of the digital commerce spending in the US in the last quarter of 2022 was from mobile devices
(Statista)
Roughly 40% of the total US digital commerce spending in the last quarter of 2022 was from mobile devices. That is a 3% increase from the third quarter of the same year.
Considering the eCommerce statistics from 2017, the mobile commerce share of digital commerce spending has increased by 14% in the last five years.
25. Amazon was the most downloaded shopping app in the US in 2022, with 34.97 million downloads
(Statista)
On both Android and iOS operating devices, Amazon was the most downloaded shopping app in the US, with 22.44 million and 12.53 million downloads, respectively. SHEIN – fashion shopping online was the next most popular app in the US, with 26.73 million mobile downloads.
Walmart (18.92 million), Temu (14.73 million), Fetch (14.47 million), and Nike (11.69 million) were also among the most downloaded shopping apps in the US.
26. Americans spent an average of $112.29 per mobile order in the second quarter of 2022
(Statista)
The average value of an eCommerce order made through a mobile device in the US between Q2 2021 and Q2 2022 ranged between $99.86 and $112.29.
27. 62% of the orders on US retail websites were from mobile phones
Most retail website visits (76%) were from smartphones, while only 26% were from desktop devices. Additionally, most online orders (62%) were from mobile phones, while 36% of orders were done on desktops.
Frequently Asked Questions
What is the success rate of eCommerce?
The success rate of online businesses is between 10% and 20%.
Which country is No. 1 in eCommerce?
Considering the highest percentage of eCommerce sales, China is the leader in the world, with 46.3% online sales. China is also the number one country in the world by eCommerce revenue.
Why do people prefer online shopping?
The main reason people prefer online shopping over going to the store is the ability to shop no matter the time. Other reasons are the better prices, variety of products, avoiding crowds, and how easy it is to find the product they are looking for.
Conclusion
Since the first online order, the eCommerce market has been steadily growing. The eCommerce statistics help us predict that both B2B and B2C eCommerce will generate higher revenue in the future.
Seeing the reality in the eCommerce sector through numbers can help everyone, from new entrepreneurs to big companies, create the right strategy for their business.
