These SEO statistics reveal where real demand lives — and it isn’t on social feeds or behind endless ad spend.
Search captures intent at the exact moment users are ready to act, which is why organic traffic continues to drive the majority of clicks, conversions, and long-term ROI online. While paid channels get more expensive and social reach keeps shrinking, SEO remains the one channel that compounds instead of resets.
This data cuts through opinions and shows how search actually works: who wins, why rankings matter, and where growth is still accelerating.
Conversions & ROI
These SEO statistics show that SEO delivers exceptional ROI across high-value industries, with many businesses breaking even within a year, while fast site speed and local mobile intent significantly amplify conversion performance.
- For every dollar spent on SEO, businesses earn an average of over $22 (Source: SmartInsights)
- Average SEO ROI per industry varies and depends on other factors like lifetime customer value. (Source: FirstPageSage)
- According to original research by FirstPageSage (FPS), the top-ranking industries per ROI on SEO are as follows:
| Sector | SEO ROI | Months to breakeven |
| Real estate | 1,389% | 13 months |
| Medical devices | 1,183% | 10 months |
| Financial services | 1,031% | 9 months |
| Higher education | 994% | 13 months |
| Oil & gas | 906% | 10 months |
Other leading sectors include:
- If a site loads in 2 seconds or less, the conversion rate jumps 15% on mobile devices. (Source: Landingi)
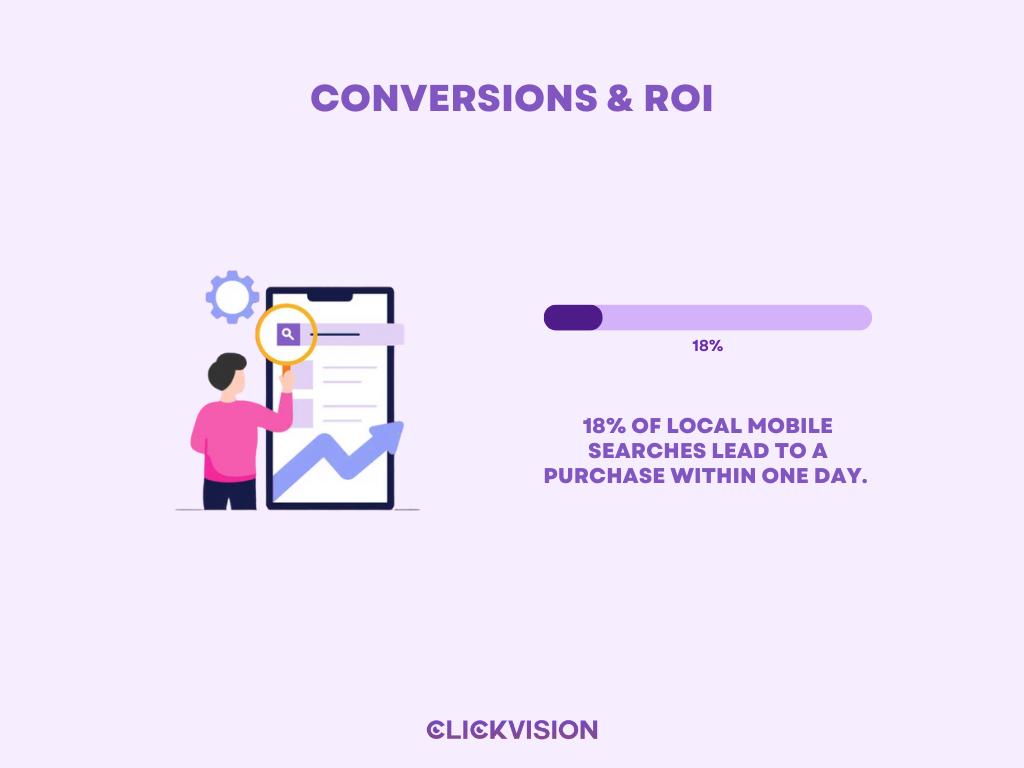
- 18% of local mobile searches lead to a purchase within one day. (Source: AIOSEO)
Market Size & Industry Economics
The data shows that the SEO industry is already a multi-billion-dollar global market and is projected to grow rapidly through 2030, with both services and software expanding at strong double-digit rates.
- The global SEO market has reached a valuation of $74.9 billion in 2025. (Source: Resourcera)
- The global search engine optimization (SEO) services market is valued at $74.9 billion in 2025 and is expected to reach $127.3 billion by 2030, growing at a steady 12.3% CAGR. (Source: Resourcera)
- The global SEO software market is valued at $74.6 billion, and is projected to reach $154.6 billion by 2030, growing at a strong 13.5% CAGR between 2025 and 2030. (Source: Resourcera)
Organic Traffic & Demand
These figures highlight that organic search dominates online discovery and traffic, making it one of the most influential channels for reaching and converting users.
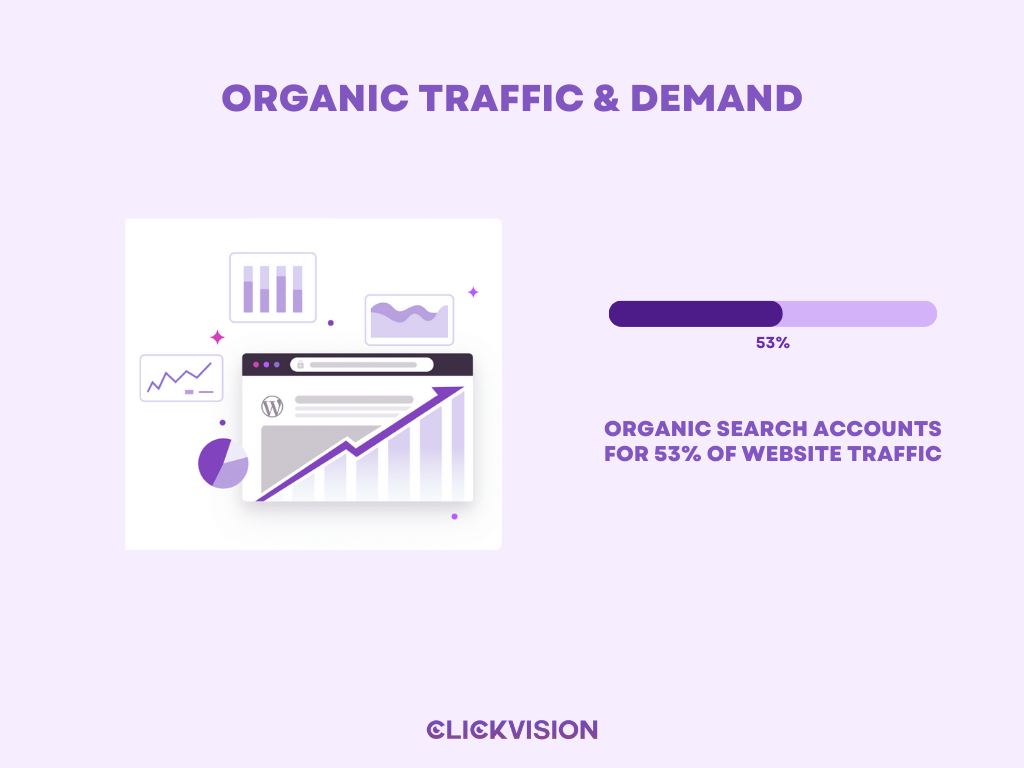
- Organic search accounts for 53% of website traffic. (Source: Embryo Agency)
- Roughly 79% of internet users use search engines regularly. (Source: StatCounter)
- 32.9% of internet users aged 16+ discover new brands, products, and services via search engines. (Source: HubSpot)
Rankings & SERPs
Click behavior in Google search is brutally top-heavy, with attention and traffic overwhelmingly concentrated on first-page results—especially the top few positions.
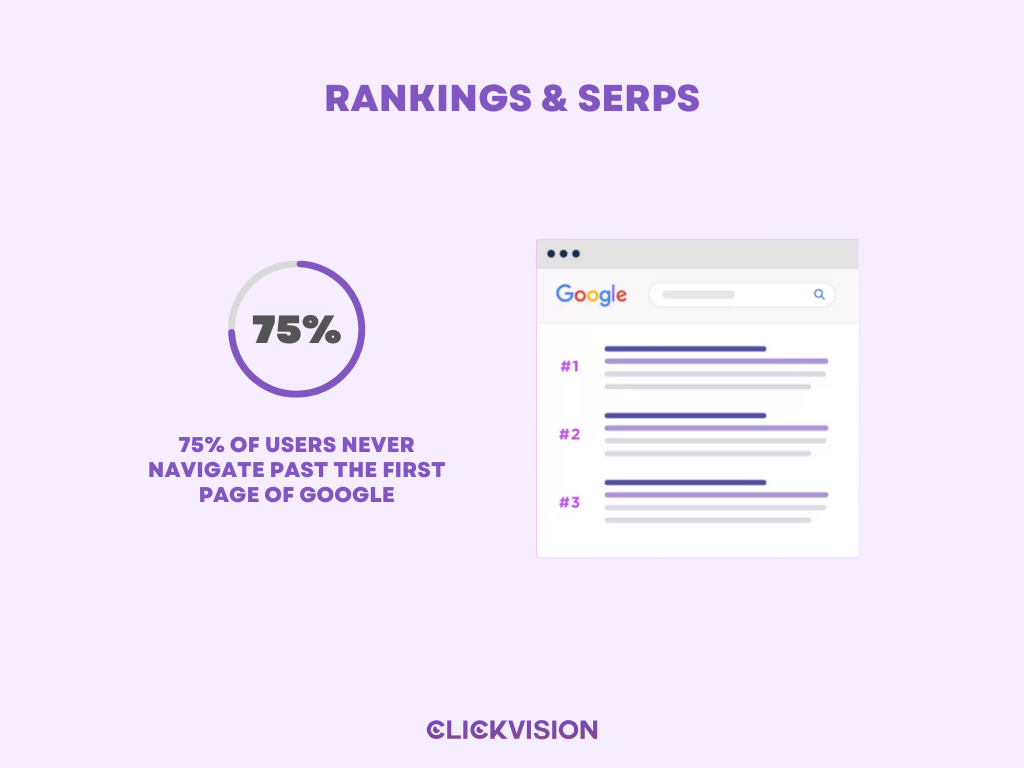
- 75% of users never navigate past the first page of Google (Source: HubSpot)
- Just 0.44% of Google users visit the second page in search results. (Source: Backlinko)
- The first five organic results in the SERPs account for nearly 70% of all clicks. (Source: Resourcera)
- The top page listed in a Google search has an average click-through rate of 25.84%. The second has an average CTR of 9.51%. (Source: Intergrowth)
- 32.3%: the click-through rate boost that can be achieved by ranking one spot higher on page 1 of Google SERP. (Source: Backlinko)
- Companies that can move up a single position in search results get a bump in CTR of approximately 2.8%, while moving from #2 to #1 can bring as much as a 74.5% boost. (Source: Backlinko)
- Featured snippets show up in roughly 12% of queries, but their presence is declining. (Source: My Codeless Website)
- Featured snippets and knowledge panels together can capture 42% of all clicks on a search results page (Source: My Codeless Website)
Access a complete collection of Google Search statistics and industry benchmarks on our Google Search Statistics page.
Content & Publishing
Search performance strongly favors depth, age, and investment, with long-form, well-funded content and video playing a decisive role in earning rankings, backlinks, and buyer trust.
- Organic search results that rank on page 1 of Google contain an average of 1,447 words. (Source: Backlinko)
- On average, long content receives 77.2% more backlinks than short articles. (Source: Backlinko)
- Around 60% of the pages ranking 10 or higher on Google were published 3 or more years ago. (Source: Ahrefs)
- Only 22% of pages that currently rank in the top 10 on Google were created in the last 12 months. (Source: Ahrefs)
- Businesses that spend $4,000 or more per article are likelier to report content marketing success vs. those who spend $500 or less. (Source: Siege Media)
- Short-form video content is the most popular media format used by content marketers. (Source: HubSpot)
- 73% of people say that the optimal length for an effective video is under 2 minutes. — (Source: HubSpot)
- Around 51% of consumers rely on product videos to make an educated purchase decision. (Source: HubSpot)
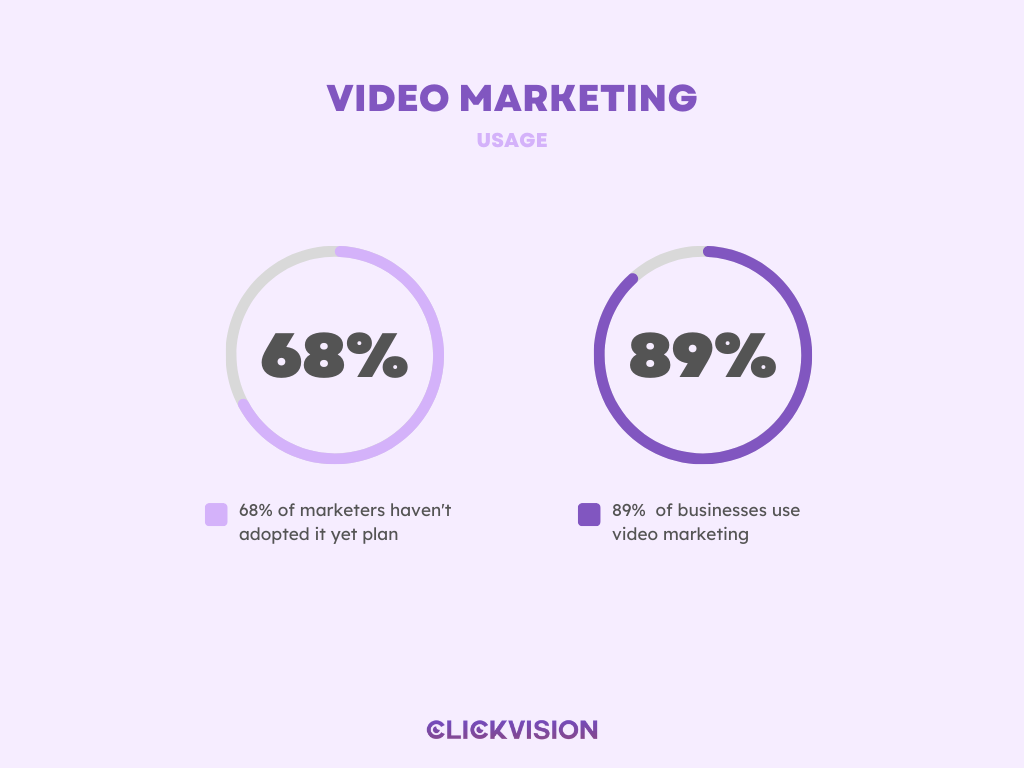
- 89% of businesses use video marketing, while 68% of marketers who haven’t adopted it yet plan to do so in 2025. (Source: HubSpot)
Backlinks & Authority
Authority in Google search is still built on backlinks, with top-ranking pages earning significantly more links and referring domains than the vast majority of content that never attracts any at all.
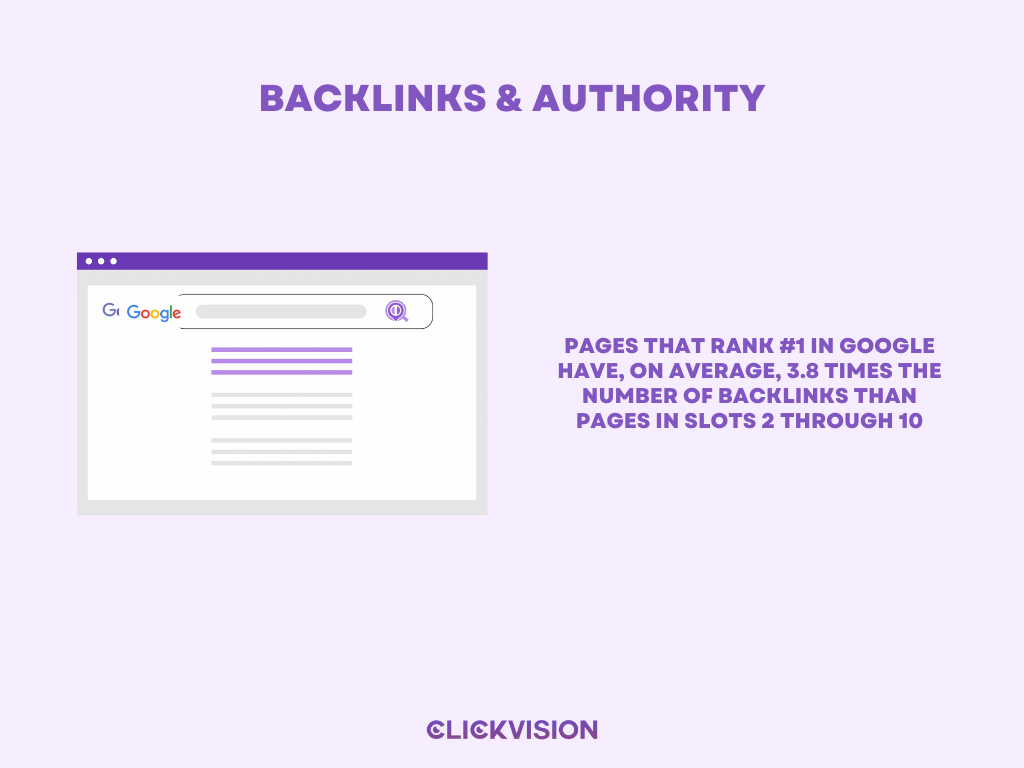
- Pages that rank #1 in Google have, on average, 3.8 times the number of backlinks than pages in slots 2 through 10. (Source: Backlinko)
- Additionally, the #1 ranking result has 3.2 more referring domains. (Source: Backlinko)
- Websites that appear on the first page of Google search results have an average of 200 backlinks. (Source: Backlinko)
- 95% of all pages have no backlinks at all. (Source: Backlinko)
- Almost 80% of SEO professionals view link building as a crucial part of their strategy. (Source: Authority Hacker)
User Behavior & Engagement
Search behavior is fast, decisive, and massively scaled, with users making quick click decisions, engaging with only a handful of pages, and generating trillions of Google searches each year.
- 65% of users who search on Google click at least one of the organic search results they’re presented with, highlighting the importance of ranking well on the platform. (Source: Backlinko)
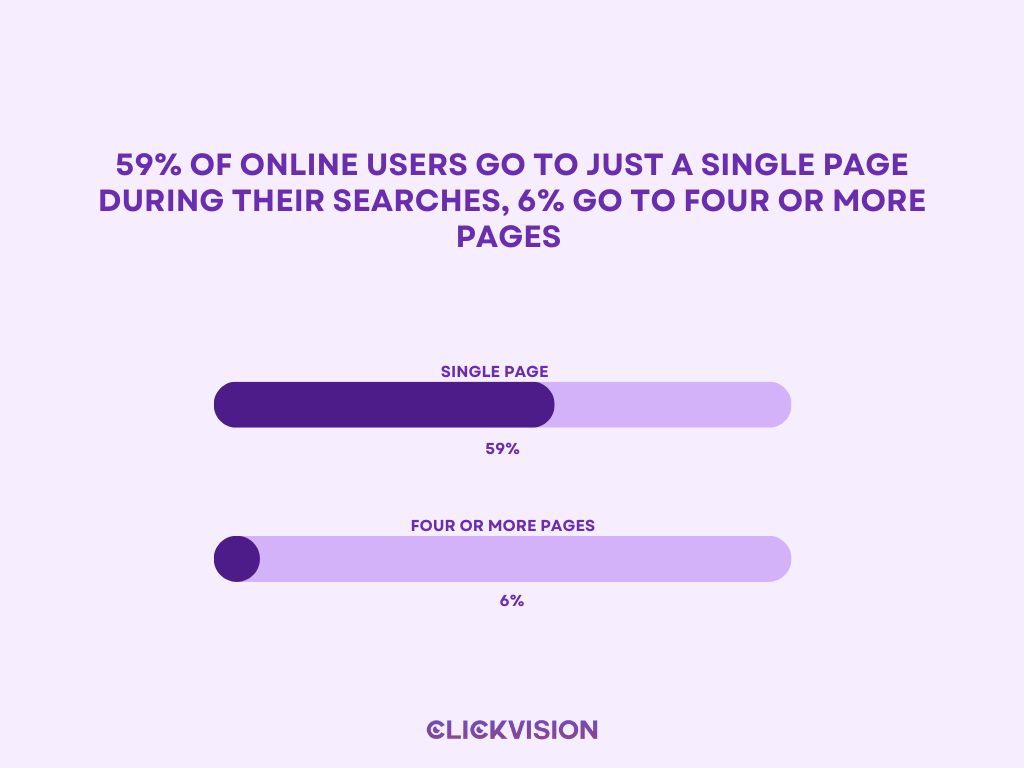
- 59% of online users go to just a single page during their searches, while 6% go to four or more pages. (Source: Backlinko)
- 50% of users on Google will click a page within 9 seconds, with the overall average time for a click being 14.6 seconds. (Source: Backlinko)
- 17% of users revisit their search results after clicking on an initial page, but only 5% come back more than once. (Source: Backlinko)
- Semrush found that users visit 3–3.5 pages every time a user lands on a website from search. (Source: Semrush)
- The average bounce rate for domains ranking in the top 3 spots is 49%. (Source: Semrush)
- The average time on site for a top 10 search result is 3 minutes and 10 seconds. (Source: Searchmetrics)
- Number of searches in Google in 2025:
- 190,000 searches per second in 2025, up from 81,000 searches in 2020. (Source: Exploding Topics)
- 11.4 million searches per minute in 2025, up from 4.9 million searches in 2020. (Source: Exploding Topics)
- 683.3 million searches per hour in 2025, up from 292 million searches in 2020. (Source: Exploding Topics)
- 16.4 billion searches per day in 2025, up from 7 billion searches in 2020. (Source: Exploding Topics)
- 498.8 billion searches per month in 2025, up from 212 billion searches in 2020. (Source: Exploding Topics)
- 5.99 trillion searches per year in 2025, up from 2.55 trillion searches in 2020. (Source: Exploding Topics)
Local SEO
Local search is a direct driver of offline action, with high-intent queries leading to map clicks, store visits, and purchasing decisions within hours—not days.
- 46% of Google searches have local intent. (Source: Search Engine Roundtable)
- 8 in 10 U.S. consumers search for a local business online at least once a week. (Source: Resourcera)
- 76% of “near me” searchers visit a business within a day. (Source: Resourcera)
- 42% of users conducting local searches click results on the Google Map Pack. (Source: AIOSEO)
- 86% of people look up a business location on Google Maps. (Source: AIOSEO)
- 81% of consumers use Google Reviews to assess local businesses. (Source: BrightLocal)
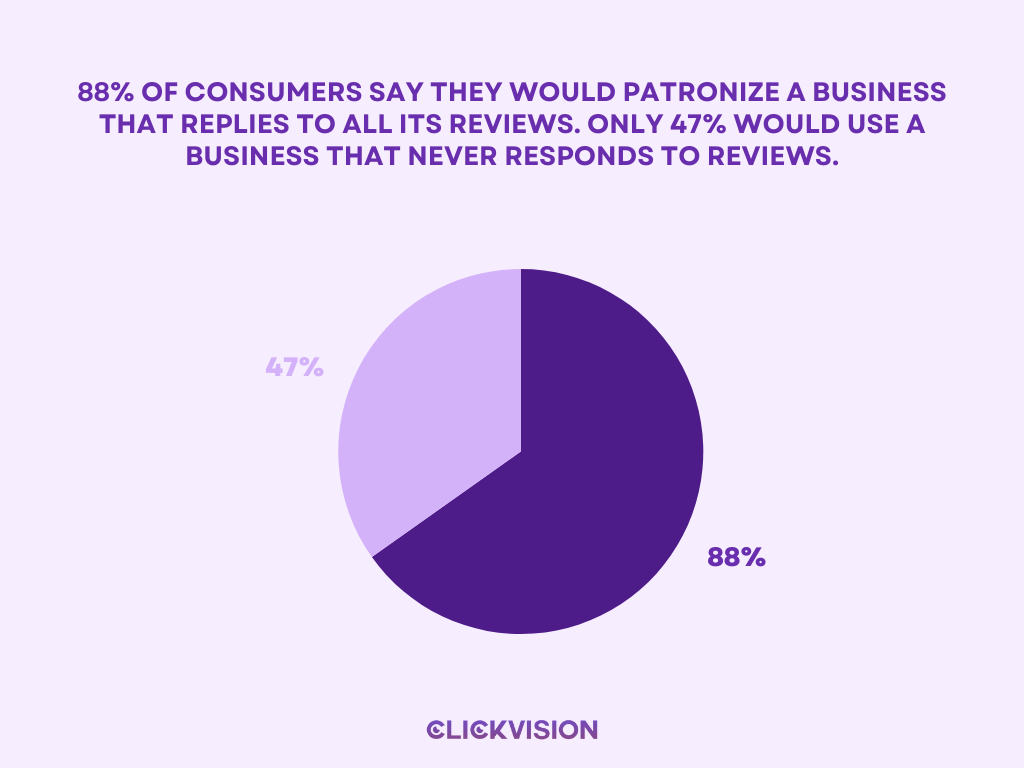
- 88% of consumers say they would patronize a business that replies to all its reviews. (Source: BrightLocal)
For in-depth, up-to-date local SEO statistics and actionable insights, explore our comprehensive Local SEO Statistics resource.
Mobile & Page Experience
Mobile now dominates how users access the web, yet most websites still fail to meet performance and experience standards that directly influence rankings, engagement, and conversions.
- Google accounts for 95% of the mobile search engine market. (Source: StatCounter)
- As of March 2025, 63.31% of all web traffic comes from mobile devices. (Source: StatCounter)
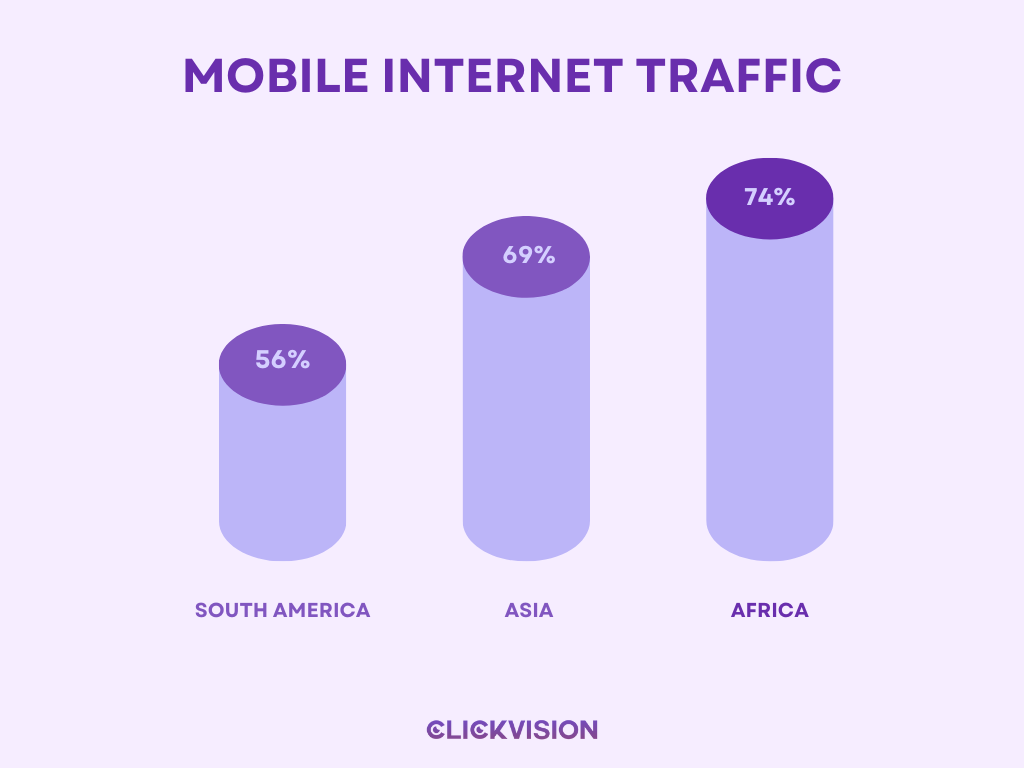
- Mobile internet traffic as a percentage of total traffic is highest in Africa (74%), Asia (69%), and South America (56%). (Source: Statista)
- 80% of top-ranking websites are mobile-optimized. (Source: Resourcera)
- Only about 43.4% of websites pass all three Core Web Vitals on mobile devices. (Source: DebugBear)
- Nearly 86% of marketers said that a slow site speed is the main reason that visitors choose to leave a website. (Source: GoodFirms)
Social Media
Social platforms dominate reach and engagement at a global scale, with video and influencer-driven content delivering the strongest returns—but they primarily fuel awareness rather than capture high-intent demand.
- Facebook is the top social media channel that B2B and B2C marketers plan to invest in in 2025. (HubSpot State of Marketing Report, 2025). (Source: Hubspot)
- 28% of marketers report seeing the highest ROI from social media influencers from Facebook. (HubSpot State of Marketing Report, 2025). (Source: Hubspot)
- Instagram has 2 billion monthly active users globally (Backlinko, 2025). (Source: Hubspot)
- 22% of marketers report that niched Instagram influencers deliver the next high ROI repkafter Facebook. (HubSpot State of Marketing Report, 2025). (Source: Hubspot)
- LinkedIn has over a billion members across 200 countries and regions (LinkedIn, 2025). (Source: Hubspot)
- Pinterest has 553 million monthly active users (Pinterest, 2025). (Source: Hubspot)
- 61% of Pinterest’s users in the United Kingdom have purchased as a result of seeing branded content on the platform (Pinterest, 2025). (Source: Hubspot)
- GenZ makes up 42% of Pinterest’s global user base and is the #1 group adopting the platform. (Pinterest, 2025). (Source: Hubspot)
- 96% of top searches on Pinterest are unbranded (Pinterest, 2025). (Source: Hubspot)
- Snapchat has 453 million daily active users and 850 million monthly active users worldwide (Snapchat, 2025). (Source: Hubspot)
- Snapchat users created over 1 billion monthly snaps in Q4 of 2024 (Snapchat, 2025). (Source: Hubspot)
- About 64% of the world’s population uses social media (DataReportal, 2025). (Source: Hubspot)
- Short-form videos, including TikTok, Instagram Reels, and YouTube Shorts, are the most widely used video formats by marketers, with 29.18% incorporating them into their strategies. (HubSpot State of Marketing Report, 2025). 21% of marketers say short-form videos deliver the highest ROI. (HubSpot State of Marketing Report, 2025). Short-form video is the leading content format marketers intend to prioritize, with 17.13% planning to increase their investment in it. (HubSpot State of Marketing Report, 2025). (Source: Hubspot)
Discover the latest social media marketing statistics, trends, and data-driven insights by visiting our dedicated Social Media Marketing Statistics page.
Technical SEO
Technical SEO quietly determines whether content can compete at all, with foundational elements like structure, markup, and metadata still separating first-page results from the majority of invisible pages.
- Google uses over 200 ranking factors in its search algorithm. (Source: AIOSEO)
- 87.7% of websites use HTTPS. (Source: W3Techs)
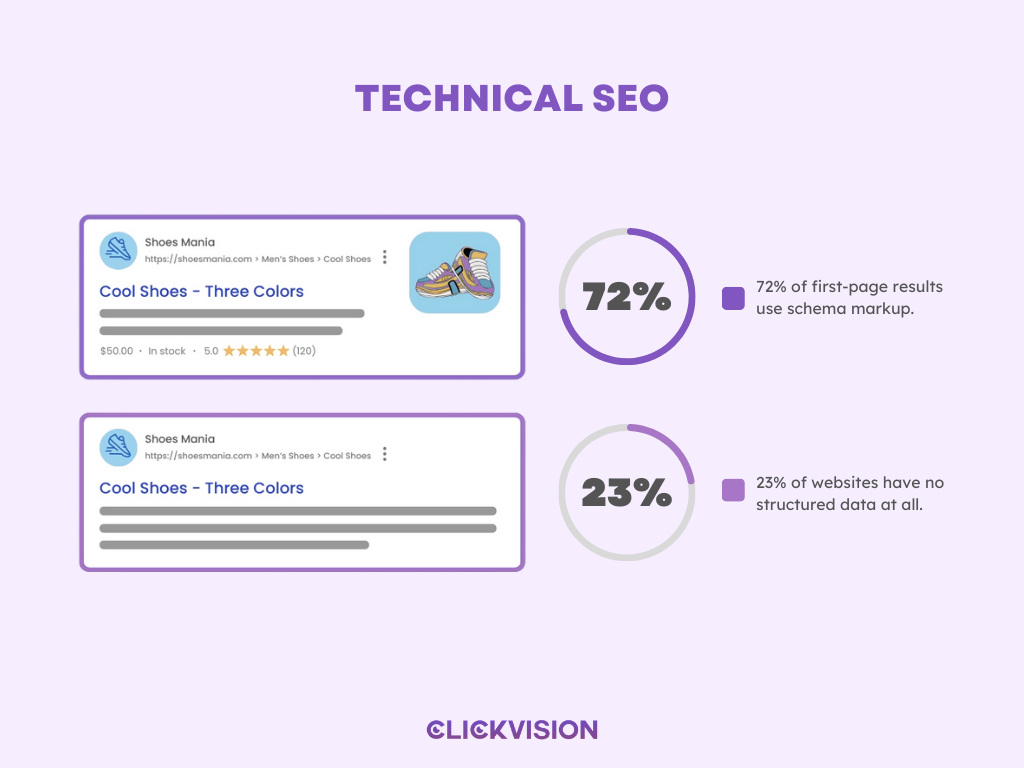
- 72% of first-page results use schema markup. (Source: Backlinko)
- Still, 23% of websites have no structured data at all. (Source: W3Techs)
- Google rewrites between 60% and 70% of all meta descriptions. (Source: Search Engine Land)
- Title tags between 40–60 characters tend to get about 8.9% higher CTR. (Source: Backlinko)
- About 7.4% of high-ranking pages have no title tag and around 25% lack a meta description. (Source: Ahrefs)
AI, Search Innovation & Tools
AI is reshaping how search results are displayed and produced, but the data shows that traditional search still dominates volume, intent, and ROI—while AI tools increasingly act as accelerators rather than replacements for SEO.
- In January 2025, AI Overviews appeared in 30% of search results and 74% of problem-solving queries. (Source: Search Engine Journal)
- AI Overviews reach over 1 billion users each month. (Source: Think With Google)
- AI Overviews also show the exact search only 5.4% of the time. (Source: Surfer SEO)
- 87.6% of Google search results have little to no AI content & Google search results include 19% of AI content as of January 2025. (Source: Graphite)
- Thirteen percent of top-ranking articles are AI-written. (Source: Originality)
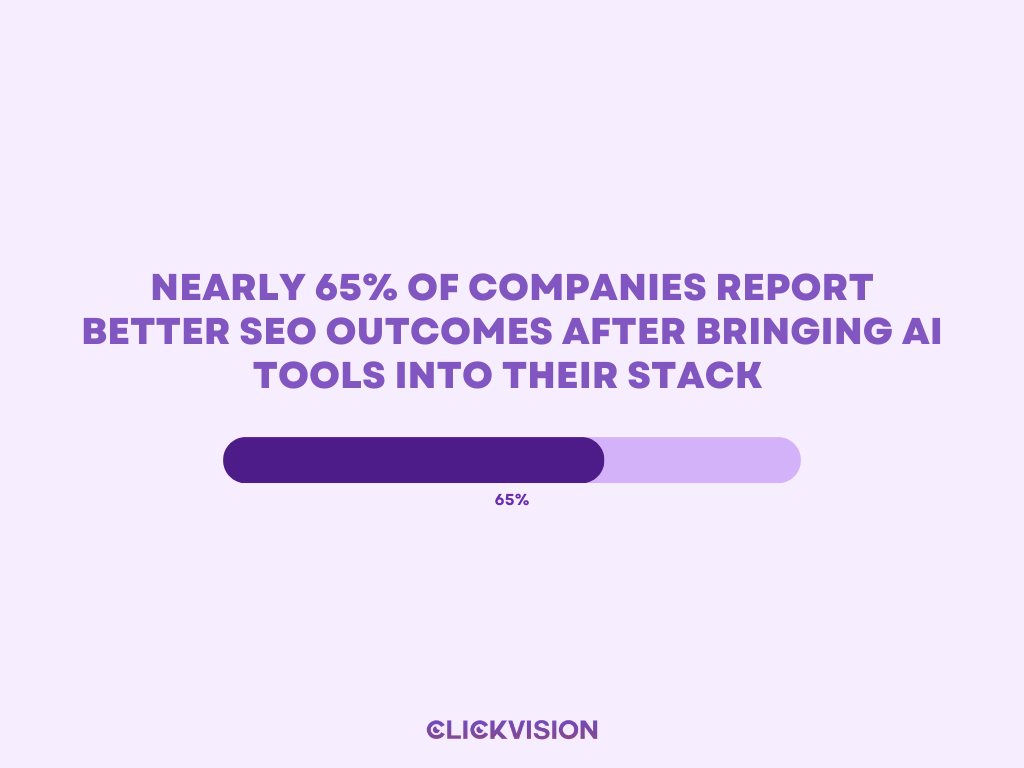
- Nearly 65% of companies report better SEO outcomes after bringing AI tools into their stack. (Source: Semrush)
- Google Search received 373X more queries than ChatGPT in 2024. (Source: SparkToro)
- SEMrush, Ahrefs, and SEO Surfer are the most popular tools — Source: ChatGPT conversation (no external source provided)
These SEO statistics make one thing clear: search is still the highest-intent, highest-ROI channel in digital marketing.
Clicks concentrate at the top, authority compounds, and organic visibility continues to outperform short-term tactics that demand constant spend. AI hasn’t changed that reality — it’s amplified the advantage of sites with strong foundations.
Ignore the data and you’ll keep paying to rent attention.
Build around it, and SEO becomes an asset that compounds while competitors fall behind.
