
TikTok marketing statistics for 2026 tell a clear story: money is following attention, and fast. Brands aren’t just testing the platform anymore. Mid-market companies are shifting real budget toward it, chasing customers who already spend hours there, from a For You Page scroll to a live shopping session.
This guide breaks down the numbers behind that shift. You’ll find ad spend and ROI figures, engagement rates by industry, and TikTok Shop’s growth. Below, we’ll cover creator costs, search behavior, and what actually drives a purchase. Each section pulls from named sources, so you can see exactly where the data comes from.
TikTok Ad Budgets and Spend Growth
Budget commitment to TikTok jumped in 2025, and the platform’s share of overall digital ad spend is projected to keep climbing through 2026.
Marketer Budget Allocation
- Over half of marketers surveyed in 2025 planned to put more than half of their total budget into TikTok. (Statista)
- A separate 2025 survey found 51% of marketers now allocate more than half their digital budgets to TikTok. (Amra and Elma)
- Mid-market brands ($10M-$100M in annual revenue) allocate an average of 62.3% of their total social media budget to TikTok. (Amra and Elma)
The two majority-budget figures land close together, and the 62.3% mid-market number suggests brands with real budgets to move, not just startups testing the platform, are driving the shift.
Ad Revenue and Spend Projections
| Metric | 2025 | 2026 (Projected) | Source |
| TikTok’s share of global digital ad budgets | 13.2% | 18.4% | Amra and Elma, citing Warc |
| TikTok US ad revenue | N/A | $13.7B (+37% YoY) | Amra and Elma, citing eMarketer |
| Global influencer marketing spend on TikTok | $6.5B | $9.3B | Amra and Elma, citing Influencer Marketing Hub |
- CPG brands are the single biggest spender on TikTok US ad revenue, at $2.4 billion for 2026. (Amra and Elma)
TikTok’s US ad revenue is projected to grow 37% in 2026, faster than its 5.2-point gain in ad-budget share, which points to advertisers paying more per impression, not just shifting more spend toward the platform.
Platform Adoption and Ad Performance Sentiment
- Only 26% of marketers are currently using TikTok at all, well below the budget-commitment figures above. (Sprout Social)
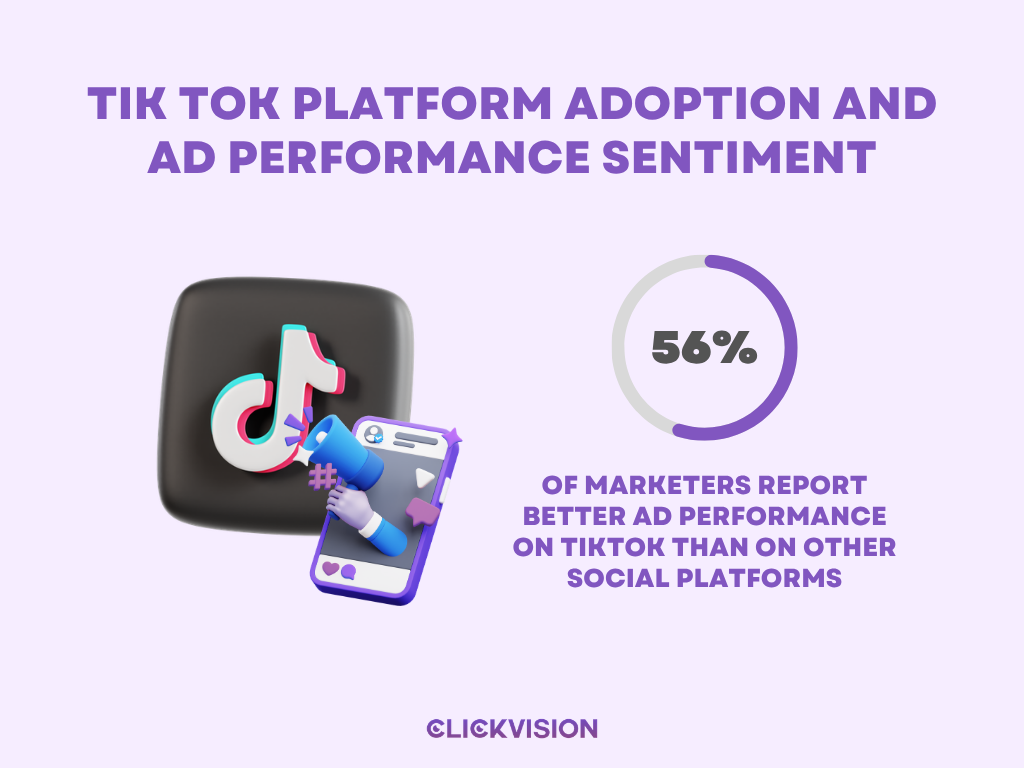
- 56% of marketers report better ad performance on TikTok than on other social platforms. (SocialPilot)
- The United States generates just 10% of TikTok’s global user base but accounts for 41% of the platform’s total advertising revenue. (SocialPilot)
The 26% and 56% figures aren’t in conflict: TikTok hasn’t reached the same level of adoption among marketers as Facebook and Instagram, but among those who have committed budget, most report better ad performance on TikTok. For additional context, our Facebook marketing statistics and Instagram marketing statistics explore audience reach, engagement, and advertising trends across both platforms.
Influencer Marketing Usage
- 31% of marketers include TikTok in their influencer marketing plans, more than any other platform. (Metricool)
- A separate survey found 61% of marketers use TikTok for influencer marketing specifically, a higher figure likely tied to different survey wording (“include in plans” vs. “currently use”). (Amra and Elma)
Marketer Sentiment and Campaign Challenges
Not every part of the TikTok playbook runs smoothly, and marketers are candid about where the friction sits.
- Driving traffic to TikTok Shop was the single most-cited challenge, named by over half of marketers in 2025. (Statista)
- Nearly 16% of marketers reported no major challenges monetizing content on TikTok in 2025. (Statista)
- About two-thirds of marketers still pick influencers by follower count first, ahead of engagement rate or niche fit. (Statista)
The top challenge, driving traffic to Shop, lines up with the blunt follower-count approach to picking influencers named in the same survey.
ROI, ROAS and Cost-Per-Click Benchmarks
TikTok ad spend tends to pay off, though the exact multiple depends on who measured it.
Return on Ad Spend
- Among small businesses running TikTok ads, 51% report a positive ROI and another 45% break even, leaving few advertisers actually losing money. (Shopify)
- Average campaign ROI runs around $6.50 for every dollar spent, with top-performing US marketers seeing returns as high as 14:1. (Metricool)
- A separate benchmark puts average ROAS at roughly $2 in revenue per $1 spent, a 2:1 return. (Teleprompter)
The $6.50 and 2:1 figures aren’t measuring the same thing head-to-head; they likely reflect different advertiser samples and campaign mixes, so read both as directional rather than as a single universal multiple. For campaigns sending TikTok users to a website, tracking actions after the ad click helps distinguish traffic from meaningful engagement. That can include recording button clicks in Google Analytics to measure interactions such as quote requests, booking actions, or other conversion steps.
Cost-Per-Click by Campaign Type
| Metric | Value | Source |
| Average CPC, all campaign types | $0.22 | Teleprompter |
| Average CPC, video-view campaigns | ~$6.00 | Teleprompter |
| Share of all ad clicks from Traffic campaigns | 67% (highest CTR of any objective) | Teleprompter |
The CPC gap comes down to what each objective bids for: Traffic campaigns compete for cheap, high-volume clicks, while video-view campaigns bid for scarcer watch-time signals, which is also why traffic drives two-thirds of all clicks. A low CPC can still produce expensive leads if visitors leave without taking action. For TikTok campaigns directing users to an external website, improving the landing page experience can be just as important as reducing the cost of attracting visitors.
Copy
Format-Driven Performance Lifts
- Spark Ads deliver 34% higher conversions than standard in-feed ads. (SocialPilot)
- Brands in Southeast Asia running two to three Hashtag Challenge campaigns a year see 20% higher ROAS than brands running just one. (TikTok’s own regional data)
Engagement Rate Benchmarks
TikTok’s engagement rate is the most-cited number in every platform comparison, and it’s also the least consistent one, because sources calculate it differently: some use the mean, some use the median, and panel sizes range from a few hundred accounts to millions of posts.
Cross-Platform Comparison
| Source | TikTok Engagement Rate | Comparison |
| Sprout Social (Socialinsider) | 3.73% (mean) | Under 1% on other major platforms |
| SocialPilot (Socialinsider, 2026) | 3.70% (+49% YoY) | Instagram 0.48%, Facebook 0.15%, X 0.12% |
| Shopify | 1.73% (median) | Facebook 0.046%, Instagram 0.36%, X 0.015% |
| Teleprompter | 2.65% (mean) | Highest of platforms tracked |
| Amra and Elma (Influencer Marketing Hub, 2026 projection) | 2.34% | 291% premium over Instagram’s 0.60% |
- Relative to competitors, TikTok’s engagement rate runs nearly 5 times Instagram’s and more than 37 times Facebook’s, and the platform draws 93% more interactions than Instagram Reels. (Metricool)
- Average post views climbed from 6,268 in 2024 to 6,496 in 2025, a 3% increase. (Sprout Social)
The range looks large, but every source that reports TikTok against competitors in the same study puts TikTok first by a wide margin. The disagreement is about the size of the lead, not whether TikTok has one. Higher engagement doesn’t automatically make TikTok the better channel for every campaign. Platforms can serve different objectives, from brand discovery and community interaction to website traffic and customer acquisition. For more context on how the wider industry compares, see our social media marketing statistics.
Engagement by Industry
| Industry | Engagement Rate |
| Higher education | 7.36% |
| Nonprofits | 3.04% |
| Travel | 2.73% |
| Sports teams | 2.68% |
| Food and beverage | 2.04% |
| Alcohol brands | 1.76% |
Source: Shopify
Engagement by Region
75.2%
Kuwait
78.3%
Saudi Arabia
Highest engagement rate in the world
68.6%
United Arab Emirates
Source: EmbedSocial, citing Arab News.
Creator-Level Engagement
- The average TikTok post carries an 18% engagement rate, with 6-7% typical across most industries. (House of Marketers)
- The platform’s top 10% of creators achieve engagement rates between 12% and 18%. (SocialPilot)
House of Marketers’ 18% average actually sits above SocialPilot’s top-10%-of-creators range, likely due to a smaller sample; treat the 6-7% figure it also reports as the more representative baseline.
Ad Formats, Reach and Purchase Behavior
TikTok’s own advertiser insights page breaks down performance by ad format, and the pattern is consistent across formats: TikTok-native creative outperforms comparable ads on other platforms, particularly among Gen X users.
Addressable Ad Audience
| Period | Reach | Source |
| January 2025 | 1.59 billion adults 18+ | Amra and Elma |
| 2026 (projected) | 1.68B+ adults 18+ | Amra and Elma |
Dynamic Showcase Ads
- 66% of Gen X weekly users worldwide find these ads convenient to buy through, and 57% say they’ll probably or definitely purchase after viewing one.
- US users are 5 times more likely to like, share, comment on or bookmark a Dynamic Showcase Ad than a comparable ad on other platforms.
- Gen X users worldwide spend 1.5 times as long watching them.
Source: TikTok advertiser insights
Lead Generation Ads
75%
of Gen X weekly users
say these ads catch their attention.
78%
of Gen X weekly users
say they’d seek more product information afterward.
66%
of Gen X weekly users
say they’ll probably or definitely buy.
Source: TikTok advertiser insights
Attention and purchase intent are useful signals, but lead generation campaigns also need a way to identify which prospects are ready for follow-up. That creates a connection with AI-assisted lead qualification and prioritization, a broader area covered in our AI lead generation statistics.
Collection Ads
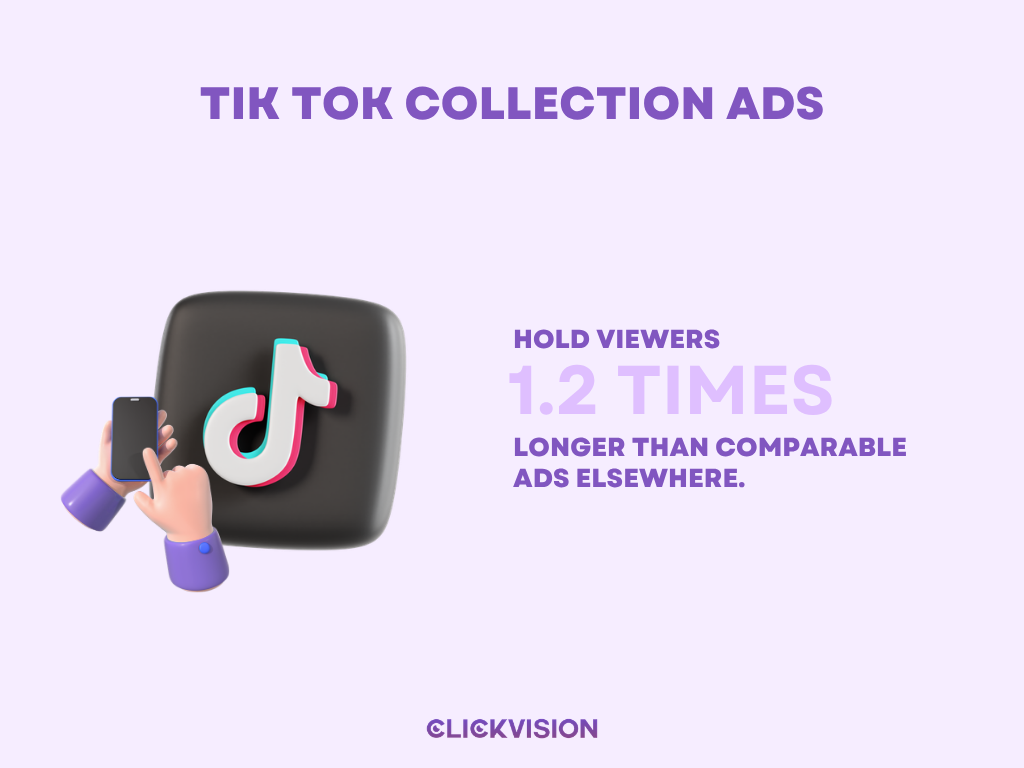
1.2 times longer
than comparable ads elsewhere.
1.5 times
more engagement.
43%
of Gen X users say they’d follow the brand
57%
of Gen X users say they’ll probably buy.
Source: TikTok advertiser insights
Note: TikTok retired both (Collection and Dynamic Showcase Ads) as standalone formats on April 3, 2023. The stats above are historical, measured while they were active. Their functionality now lives inside Video Shopping Ads and, more recently, Smart+ Catalog Ads and GMV Max, so the shopping experience they describe still exists, just under different names and with more automation handling targeting and creative selection.
Paid and Organic Combination Effects
- Users exposed to both a Shop Ad and an organic post are 1.3 times more likely to watch without skipping than those who saw only the organic post; that rises to 1.4 times among Gen X.
- Among Gen X exposed to an organic ad: 79% would likely buy from the brand in the future, 78% would consider it.
- Among Gen X exposed to a Shop Ad: 81% see the brand favorably, 78% would likely buy.
Source: TikTok advertiser insights
Creative and Trend Alignment
- Ads that feel modern or on-trend are 1.3 times more likely to register as native content.
- Fashion ads using TikTok trends are 1.5 times more likely to hook a viewer than ads that don’t.
- Repurposing an ad for TikTok with three creative edits lifts full-funnel impact by 9.3% on average.
Source: TikTok advertiser insights
Regional Case: Turkey
- 1 in 3 TikTok users in Turkey follows a brand on the platform; 38% of those started following after seeing the brand on their For You page.
- Among Turkish users who follow a brand: 72% advocate for it, 88% engage with its content, 1 in 3 has purchased from it, and 1 in 3 trust the brand more than before following.
Source: TikTok advertiser insights
Taken together, the format data tells a consistent story: TikTok ads that mimic organic content outperform ads that look like traditional media buys, and Gen X shows up disproportionately across all of it.
| Ad Format | Key Outcome | Population |
| Dynamic Showcase Ads | 5x more likely to like/share/comment/bookmark vs. other platforms | US users |
| Lead Generation Ads | 75% say the ad catches their attention | Gen X, worldwide |
| Collection Ads | 1.5x more likely to engage vs. comparable ads elsewhere | Gen X, worldwide |
| Shop Ads + organic combo | 1.4x more likely to watch without skipping | Gen X, worldwide |
| Spark Ads | +34% conversions vs. standard in-feed | All advertisers (SocialPilot) |
Content and Creative Performance
Posting cadence, hook timing and video length all show measurable effects on TikTok distribution.
Posting Frequency and Post-Level Metrics
- Brands post an average of 15 times a month, or five times a week. (Sprout Social)
- A study analyzing 9.2 million recommended videos across 347 TikTok users found viewers watch about 55% of videos through to the end. (Printful)
| Metric | Value | Source |
| Average likes per post | 3,492 (+12% YoY) | Printful / SocialPilot |
| Average comments per post | ~50 | Printful / SocialPilot |
| Average shares per post | 248 | Printful |
| Video completion rate | ~55% watched to the end | Printful |
Hook Timing and Emotional Tone
- 63% of successful ads deliver their core message within the first three seconds. (House of Marketers)
- 50% of the highest-converting ads strike a positive emotional feeling. (EmbedSocial)
- Ads where someone talks directly to the camera convert 33% better. (EmbedSocial)
- 33% of customers respond better to ads that break the fourth wall and speak to them directly, a separate audience-response metric. (House of Marketers)
The two 33% figures are a coincidence rather than the same metric, one’s a conversion lift, the other a self-reported preference, but both point to the same creative choice: direct address to camera.
Format and Length
- Vertical video gets a 25% better watch-through rate than horizontal video. (EmbedSocial)
- Vertical-format six-second clips pick up 25% more views than horizontal versions of the same length. (House of Marketers)
- Videos between three and ten minutes now outperform shorter clips on watch time, completion rate and algorithmic distribution. (SocialPilot, citing Buffer)
- 67% of users prefer brand content built around trending music. (Metricool)
| Metric | Value | Source |
| Share of US watch time from 3-8 min videos, 2022 | 9% | SocialPilot |
| Share of US watch time from 3-8 min videos, 2025 | 41% | SocialPilot |
The jump from 9% to 41% is the clearest signal here that TikTok’s short-form reputation no longer matches how people actually watch the app.
Search and Discovery Behavior
TikTok’s role as a search tool keeps expanding, though how big it looks depends heavily on the survey population.
TikTok as a Search Engine, by Source
| Source | Population | Search-Engine Usage |
| Metricool | Gen Z | 67% |
| House of Marketers | Gen Z | 62% (plus 1 in 10 preferring TikTok over Google) |
| Teleprompter | Gen Z | ~40% prefer TikTok/Instagram over Google |
| SocialPilot / Adobe Express, 2024 | US consumers, general | 41% |
| SocialPilot / Adobe Express, 2026 | US consumers, general (Gen Z: 65%) | 49% |
The spread, 40% to 67%, comes down to which population was asked (Gen Z alone versus all US consumers) and what counted as “search.” The Adobe Express row is the most useful for tracking change over time, since it’s the only one with a consistent 2024-to-2026 comparison. TikTok search also serves a different purpose from many traditional Google searches. Video results let users see products, experiences, and recommendations in action, while Google provides access to a wider range of websites and information formats. Our Google Search statistics offer additional context on the broader search market.
In-App Search Activity
- TikTok’s overall search volume grew more than 40% year-over-year, with billions of searches happening daily. (SocialPilot)
- 45% of users keep searching after their first result, evidence the platform functions as a multi-step research tool. (SocialPilot)
- Desktop search activity rose from 11% to 15.4% between 2023 and May 2024; in-app search is projected to reach a 21.7% monthly active rate across all devices in 2026. (Amra and Elma, citing Adobe Digital Insights)
- Searches for “small business” on TikTok were up 479% in Q1 2026; “boutique small business” searches jumped 758% in the second half of 2025. (SocialPilot)
Product Discovery and Purchase Influence
TikTok’s influence on what people buy is one of the most consistently reported findings across every study in this space.
Gen Z Product Discovery
- 42% of Gen Z consumers turn to TikTok for product discovery, a figure reported independently by both Sprout Social and Metricool. Sprout’s 2026 Content Strategy Report names TikTok the top product-discovery channel for that generation specifically. (Sprout Social / Metricool)
- A separate survey found a higher 77% of Gen Z turning to TikTok for discovery ahead of traditional search engines, a gap likely reflecting different survey wording. (SocialPilot)
Product discovery doesn’t necessarily mean an immediate purchase. Gen Z consumers can encounter a product on TikTok and evaluate it through other creators, reviews, or websites before deciding. For a wider perspective on marketing to this audience, explore our Gen Z marketing statistics.
Overall Purchase Influence
- Roughly 39% of all consumer purchases are influenced by TikTok in some way. (Teleprompter / Amra and Elma)
- That influence is projected to rise to 46% of all purchase decisions globally in 2026, per a January 2026 Nielsen Commerce Impact Study spanning 12 markets. (Amra and Elma)
- Roughly 25% of TikTok users are unique to the platform and don’t use Facebook or Instagram at all, meaning TikTok’s influence isn’t a subset of what those platforms already capture. (Teleprompter)
The jump from 39% to a projected 46% is the largest year-over-year move on this page; treat the 46% as a projection rather than a confirmed outcome, since the study behind it was published in January 2026 and the year is still in progress.
TikTok Shop and Social Commerce Performance
TikTok Shop’s growth is the fastest-moving number in this entire dataset.
GMV Growth
| Market | 2024 | 2025 | 2026 (Projected) | Source |
| United States | $9B | $15.82B (18.2% of US social commerce) | $20B-$23.4B | SocialPilot / Sprout Social (eMarketer) |
| Global | N/A | $64.3B (+94% YoY) | $112B+ | SocialPilot |
- TikTok Shop’s global GMV represents 68.1% of total global social shopping GMV, ahead of Instagram Checkout and Facebook Shop combined. (SocialPilot)
Global GMV nearly doubled in a single year, and the US path (roughly 50-75% year-over-year growth) is close behind. At that pace, TikTok Shop’s 68.1% share of global social commerce looks less like a peak and more like a floor.
Buyer Counts
| Buyer Metric | Figure | Source |
| US TikTok Shop buyers, 2025 (+13.6% YoY) | 53.2 million | SocialPilot (eMarketer) |
| US TikTok Shop buyers, 2026 projected | 57.7 million | SocialPilot |
| TikTok Shop shoppers, 2025 (+24.5% YoY) | 71.4 million | Printful |
| Lifetime TikTok Shop purchasers | ~870 million | Sprout Social |
Printful’s shopper count likely covers a broader geography than SocialPilot’s US-specific buyer figures, so the two numbers describe different populations rather than conflicting with each other.
Live Shopping Conversion
- TikTok Shop live sessions convert at 7.4%, more than 3 times traditional ecommerce, with an average order value of $58. (Metricool)
- A separate study found livestream selling events converting at 8.3%, more than 4 times the 2.0% industry average for traditional ecommerce display ads. (Amra and Elma, citing Nielsen)
- Half of TikTok users have made a purchase after watching a live video on the app. (Teleprompter)
- Over 11% of US households have made a TikTok Shop purchase. (Teleprompter)
Both figures clear traditional ecommerce by a wide margin; the gap between them is small enough to attribute to sample differences between the two studies rather than a real change in performance. TikTok Shop also changes the buying journey by allowing users to discover products and complete purchases without leaving the platform. This makes its performance worth examining alongside broader ecommerce statistics, which provide context on online shopping behavior beyond social commerce.
Buyer Behavior and Motivations
- 25% of TikTok Shop buyers found their item through a TikTok ad; 48% of purchases originated from influencer posts. (Sprout Social, citing PartnerCentric)
- 36% of all direct social purchases happen on TikTok, rising to 54% among Gen Z and 47% among Millennials. (Sprout Social, citing the 2025 Sprout Social Index)
- Nearly 1 in 4 consumers report making impulse purchases on TikTok Shop. (Sprout Social)
Discovery-to-Purchase Speed
- 83% of TikTok Shop users discover new products on the platform; 70% discover new brands. (SocialPilot)
- Among US users, two-thirds discovered a new brand on TikTok Shop, and 72% of those newly discovered brands were small businesses earning under $15 million a year. (SocialPilot)
- 57% buy within days of discovering a new brand; nearly 90% buy within a month. (SocialPilot)
- After a TikTok Shop experience, 45% of users overall (43% of Gen Z, 45% of Gen X) say they’re likely to buy expensive, big-ticket items. (TikTok advertiser insights)
- Gen X users are more likely to buy from small or lesser-known brands (72%) than from big, well-known ones (68%) after seeing them on TikTok Shop. (TikTok advertiser insights)
The Gen X preference for small, lesser-known brands over big ones runs against the usual assumption that older shoppers default to established names, and it points to a platform where an unfamiliar brand isn’t a barrier if the content earns trust fast.
Seasonal Performance and Top Categories
- UK TikTok Shop sales hit their highest single day ever during Black Friday 2025, with 27 items sold every second at peak demand. (Printful)
- Combined Black Friday and Cyber Monday 2025 sales rose 50% year-over-year, with shopper counts up 28%. (Printful)
- Top categories by ad-creative volume: perfume, T-shirts, phone cases and screen protectors, lipstick and lip gloss, and women’s trousers. (Printful)
Influencer Marketing Costs and Performance
Sponsored TikTok posts price out by follower tier, and the spread between the bottom and top is wide, but price doesn’t track engagement in a straight line.
Cost Per Sponsored Post by Tier
| Influencer Tier | Average Cost Per Post |
| Nano | $15 |
| Micro | $75 |
| Mid | $687.50 |
| Macro | $1,875 |
| Mega | $13,750 |
| Celebrity | $27,500 |
Source: Sprout Social
- As a rule of thumb, creators charge roughly $10 per 1,000 followers for a sponsored post. (Sprout Social)
- The average TikTok influencer post earns a 1.86% engagement rate. (Sprout Social)
Cost and engagement move in opposite directions as follower count rises, which is the core economic argument for nano and micro-influencer campaigns over celebrity endorsements.
Engagement by Influencer Tier and Category
- TV and video creators with 1,000-10,000 followers post the highest nano-tier engagement at 26.86%, ahead of college athletes (22.91%) and auto and vehicle creators (22.73%). (Sprout Social)
- Creators with over 100,000 followers can reach engagement rates as high as 5%, against 1.10% on Instagram and 0.3% on Twitter. (House of Marketers)
| Category | Nano-Influencer Engagement | Macro-Influencer Engagement |
| Lifestyle | 12.84% | 3.61% |
| Beauty | 10.14% | 2.8% |
| Fashion and Style | 14.27% | 2.8% |
| Food and Drink | 17.11% | 3.1% |
| Sports and Fitness | 14.41% | 2.54% |
Source: Sprout Social
The pattern holds across every category: nano-influencers outperform macro-influencers by roughly 3 to 5 times, with food and drink showing the widest gap.
Brand Lift From Influencer Campaigns
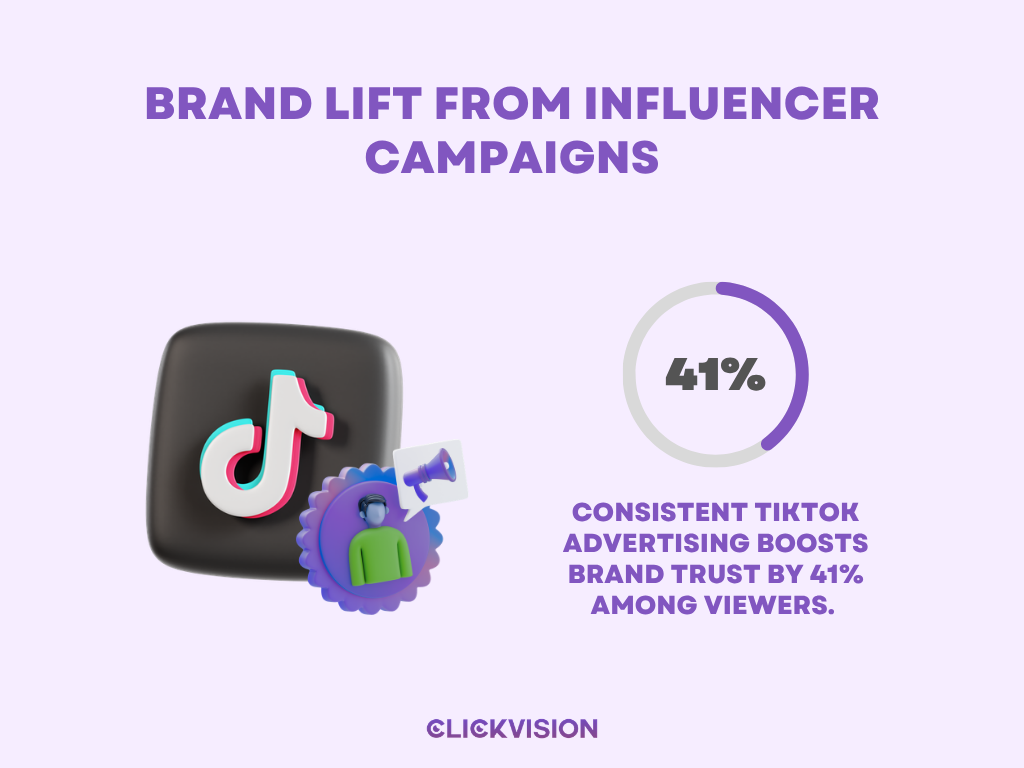
- Consistent TikTok advertising boosts brand trust by 41% among viewers. (Teleprompter)
- Ads featuring TikTok creators earn 26% higher brand favorability. (Teleprompter)
- Brand recall increases by roughly 27% when an influencer is involved, and view-through rates climb as much as 193% on creator-led content. (Teleprompter)
- A Nielsen meta-analysis of 214 campaigns from Q4 2025 found average brand recall lift from influencer-led campaigns at 34%, up from 27% in 2024; campaigns pairing a paid Spark Ad with an organic creator post produced the strongest result, a 41% average recall lift. (Amra and Elma)
- A Kantar analysis of 1,018 global campaigns found TikTok delivering 29% higher emotional engagement and 40% stronger brand recall than comparable non-TikTok placements. (SocialPilot)
Three independent large-sample studies, Nielsen, Kantar and Teleprompter, all land on brand recall lifts in the 27% to 41% range from influencer involvement, an unusual amount of agreement across unrelated research firms.
Small Business Impact and Revenue Attribution
TikTok’s economic footprint among small and medium businesses shows up in several independent studies.
- 89% of SMBs promoting on TikTok report increased sales as a result, a figure Teleprompter’s separately sourced 2024 data corroborates closely at 88%. (SocialPilot / Teleprompter)
- A matching 89% of small businesses call TikTok important to their operations, a measure of perceived importance rather than sales lift specifically. (Printful)
- TikTok helped small businesses in the food and beverage sector generate an estimated $6.4 billion in revenue in 2024 alone. (Teleprompter)
- The platform contributed $14.7 billion to small-business revenue and $24.2 billion to US GDP in 2023, supporting at least 224,000 jobs. (House of Marketers)
- US small businesses earning under $15 million a year grew their TikTok Shop sales 66% year-over-year in 2025. (SocialPilot)
- TikTok Shop now counts more than 215,000 small businesses actively selling in the US, a 25% year-over-year increase. (SocialPilot)
That $24.2B GDP figure is from 2023, before TikTok Shop’s biggest growth period, so it understates the platform’s current contribution; the 66% year-over-year sales growth among sub-$15M businesses in 2025 is the more current signal.
Brand Content Engagement Patterns
How often people engage with brand content on TikTok, and why, rounds out the picture.
Engagement Frequency and Content Preference
- 55% of Gen Z users engage with brand content at least once a day; another 30% engage at least weekly. (Sprout Social)
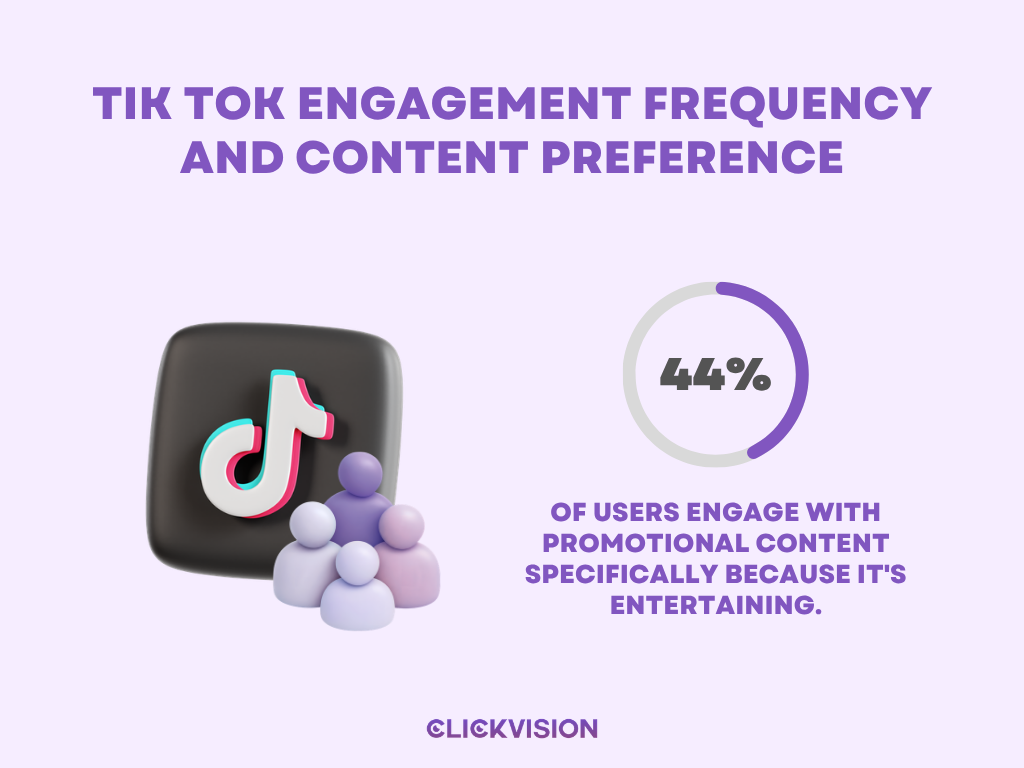
- 44% of users engage with promotional content specifically because it’s entertaining. (EmbedSocial)
- Roughly 67% name educational or how-to videos as their preferred content type. (SocialPilot)
- 73% of users say they feel a deeper connection to brands they interact with on TikTok compared with other platforms. (SocialPilot)
Discovery Through the For You Page
- The For You Page drives 7 out of every 10 views on a given post, and it’s the only traffic source that’s stayed stable year over year. (Metricool)
- A broader estimate puts For You Page views between 70% and 90% of all views, coming primarily from non-followers. (SocialPilot)
- TikTok users are 1.4 times more likely than users on other platforms to look forward to generative AI showing up in ads. (SocialPilot)
- 41% say entertaining ads make the overall platform experience better. (SocialPilot)
Follower count matters less on TikTok than on almost any other platform, since 70-90% of views come from non-followers. That’s the same dynamic behind the nano-influencer engagement data above: reach on TikTok is earned per video, not accumulated through a following.
Conclusion
TikTok marketing statistics for 2026 point to a platform still in motion, not one that’s settled. Ad spend keeps climbing, Shop sales keep compounding, and engagement rates hold well above every competitor tracked in this data. The gap between TikTok and other platforms isn’t narrowing. It’s widening.
None of these numbers guarantee results on their own. What they show is where attention and money are already moving, and that’s worth planning around. Whether a brand runs paid campaigns, works with creators, or sells through TikTok Shop, the data here gives a real baseline to measure against. With that context in hand, the next campaign decision has something solid behind it.