
Instagram has changed considerably from the photo-first platform many marketers originally built their strategies around. Reels, carousels, Stories, paid distribution, AI-assisted workflows, social commerce, and direct audience interaction now compete for the same attention, making older benchmarks increasingly difficult to apply without context.
These Instagram marketing statistics bring together current platform data, audience research, marketer surveys, and large-scale content studies. The figures cover usage, demographics, engagement, content performance, Reels, Stories, audience growth, advertising, shopping, and ROI, with the population, year, and methodology kept intact where they affect how a number should be interpreted.
Methodology note: Different studies calculate metrics such as engagement differently. Statistics from Meta, DataReportal, Metricool, Socialinsider, HubSpot, Hootsuite, Pew Research Center, Semrush, and eMarketer are therefore presented within their original scope rather than averaged together.
Instagram Usage Statistics
Instagram remains one of the largest digital platforms, but its scale alone does not explain how people use it. Frequency, news consumption, and web traffic provide additional context around how deeply the platform is embedded in everyday online behavior.
- Instagram has 3 billion monthly active users, according to Meta, which announced the milestone in September 2025.
- 55% of U.S. teens use Instagram daily, according to Pew Research data cited by Hootsuite.
- 31% of U.S. teenagers use Instagram several times per day.
- Another 12% of U.S. teens say they use Instagram “almost constantly.”
- 20% of U.S. adults regularly get news from Instagram as of 2025.
- Instagram.com was the fourth most-visited website worldwide in January 2026, according to Semrush data reported by Hootsuite. The average website visit lasted 12 minutes and 46 seconds.
The last figure measures visits to Instagram.com rather than time spent inside the mobile app, so it should not be treated as an average session length for Instagram overall.
Instagram User Demographics and Audience
Instagram’s audience is global, but two different measurements need to be kept separate. Monthly active users measure platform usage, while advertising audience estimates represent the number of people Meta says advertisers can potentially reach.
According to DataReportal, Meta’s advertising tools showed the following country audiences in January 2025:
| 414 million | India |
| 172 million | The United States |
| 141 million | Brazil |
| 103 million | Indonesia |
| 58.5 million | Turkey |
| 57.5 million | Japan |
| 48.8 million | Mexico |
| 33.4 million | The United Kingdom |
| 31.3 million | Germany |
| 28.9 million | Argentina |
These numbers should be described as advertising audiences, not country-level monthly active user totals.
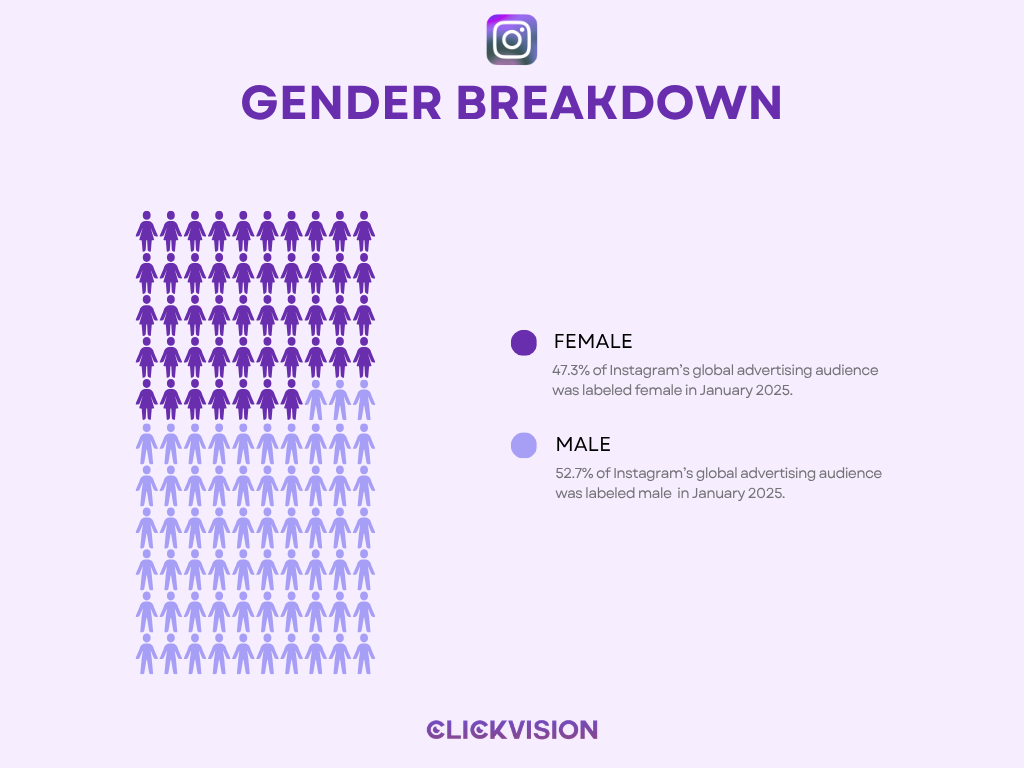
The global gender distribution in Meta’s advertising data was relatively balanced:
- 47.3% of Instagram’s global advertising audience was labeled female in January 2025.
- 52.7% was labeled male.
- Women aged 18–24 represented 14.4% of Instagram’s global adult advertising audience.
- Men aged 18–24 represented 17.2%.
U.S. adoption data shows how strongly Instagram usage varies by age. Recent Pew Research figures reported by Hootsuite found that:
50%
of U.S. Adults
use Instagram
80%
Ages 18–29
use Instagram
62%
Ages 30–49
use Instagram
40%
Ages 50–64
use Instagram
19%
Ages 65+
use Instagram
Usage also varies by household income:
- 60% of Americans earning $100,000 or more per year use Instagram.
- Usage is 54% among those earning 70,000–99,000.
- 46% of Americans earning 30,000–69,000 use it.
- Among Americans earning under $30,000, the figure is 41%.
The demographic picture is therefore more useful when segmented by market, age, and income than when reduced to a single claim about the “average Instagram user.”
For readers examining the younger end of that audience beyond Instagram alone, we’ve also compiled Gen Z marketing statistics covering the broader marketing research around this generation.
Instagram Marketing Strategy Statistics
Instagram strategies increasingly depend on data analysis and community development rather than publishing content without a clear objective.
HubSpot’s 2026 Instagram Marketing Report, based on a survey of more than 600 global B2B and B2C Instagram marketers, found that:
- 51% of surveyed Instagram marketers use AI to analyze performance, audience data, competitive intelligence, or related information.
- 20% identify growing their community or following as a top Instagram goal in 2026.
The AI figure refers specifically to analytical use cases. It should not be interpreted as the percentage of marketers using AI to generate Instagram content. That distinction matters because marketing AI extends well beyond analytics alone; our AI marketing statistics provide a broader research view of AI’s role across marketing.
Instagram Engagement Statistics
Engagement is one of the areas where statistics can appear contradictory when methodology is ignored. A follower-based engagement calculation, reach-based calculation, and study-level average can produce very different percentages from the same platform.
HubSpot’s 2026 marketer survey shows which interactions marketers most commonly see from followers:
64%
of surveyed Instagram marketers say
likes are a top form of follower engagement
56%
of surveyed Instagram marketers
cite comments
28%
of surveyed Instagram marketers
cite shares
16%
of surveyed Instagram marketers
cite direct messages
32%
of surveyed Instagram marketers say
they struggle to generate consistent likes, comments & shares
Large-scale performance research paints a more nuanced picture. Metricool’s 2026 Instagram Study analyzed more than 24 million posts from over 375,000 accounts worldwide and found that:
- Average interactions increased 19.25% year over year.
- At the same time, the study’s average engagement rate fell from 3.79% in 2025 to 3.54% in 2026, a 6.61% decline.
- Asking followers to leave a comment can triple comment activity.
- Including a simple question in a caption can increase engagement by up to 37%.
Higher interaction volume alongside a lower engagement rate is not necessarily contradictory. More content and more views can increase total interactions while the proportion of people engaging falls.
Socialinsider uses a different benchmark methodology, which produces lower percentages:
- Instagram’s overall engagement rate averaged 0.45% in Q2 2026.
- In its 2025 benchmark, Instagram averaged about 0.48% engagement, roughly 24% lower year over year.
- For 2025 specifically, Reels averaged 0.52% engagement, carousels 0.55%, and images 0.37%.
These numbers should remain attached to their respective studies. There is no responsible reason to average Metricool’s 3.54% figure with Socialinsider’s 0.45%, because they do not represent identical calculations or account samples.
Instagram Content Performance Statistics
Content performance in 2026 is less about choosing one universally superior format and more about matching the format to the desired outcome. Reels can generate discovery and interaction, carousels can accumulate saves, while images remain widely used even as their engagement benchmarks decline.
Instagram Content Types & Performance
- 68% of surveyed Instagram marketers use image posts
- 64% use video posts
- 45% publish educational or informational content
- 37% use relatable or authentic content
- 36% publish behind-the-scenes content
- 34% use funny content
- 46% say product content generates the most ROI.
Instagram Posting Habits
- 31% of surveyed marketers publish image posts multiple times per week
- 22% publish image posts multiple times per day
- 27% publish Reels multiple times per week
- 27% publish Reels multiple times per day
- 27% use between 6 and 11 hashtags per post
Metricool’s 2026 study found that brands became more active without producing a corresponding collapse in visibility:
- Brands published 24.04% more Instagram posts during the 2026 study period than in the comparable 2025 period.
- Average posting frequency increased 8.79%, from 1.19 to 1.30 posts per week.
- Average reach increased 6.56% year over year.
- Average views increased 26.56%.
- Carousels generated 9 times more saves than single-image posts.
- Single-image posts and carousels received roughly 76% of their views within the first 72 hours after publication.
- Those formats also generated about 75% of their interactions during the same first 72 hours.
Socialinsider’s current format-level engagement data shows a different side of performance:
- Carousels averaged 0.50% engagement in Q2 2026, down from 0.52% in Q1.
- Images averaged 0.33% engagement in Q2 2026, down from 0.35% in Q1.
- Static-image engagement declined 17% year over year in Socialinsider’s 2025 benchmark.
The important distinction is between raw interactions, saves, reach, and engagement rate. A carousel can outperform another format for saves without necessarily leading every other metric.
Instagram Reels Statistics
Reels have become one of Instagram’s central distribution formats, particularly for discovery and sharing.
Meta reports that people reshare Reels more than 4.5 billion times every day across Meta platforms. That figure includes Meta’s broader ecosystem, so it should not be described as 4.5 billion Instagram-only shares.
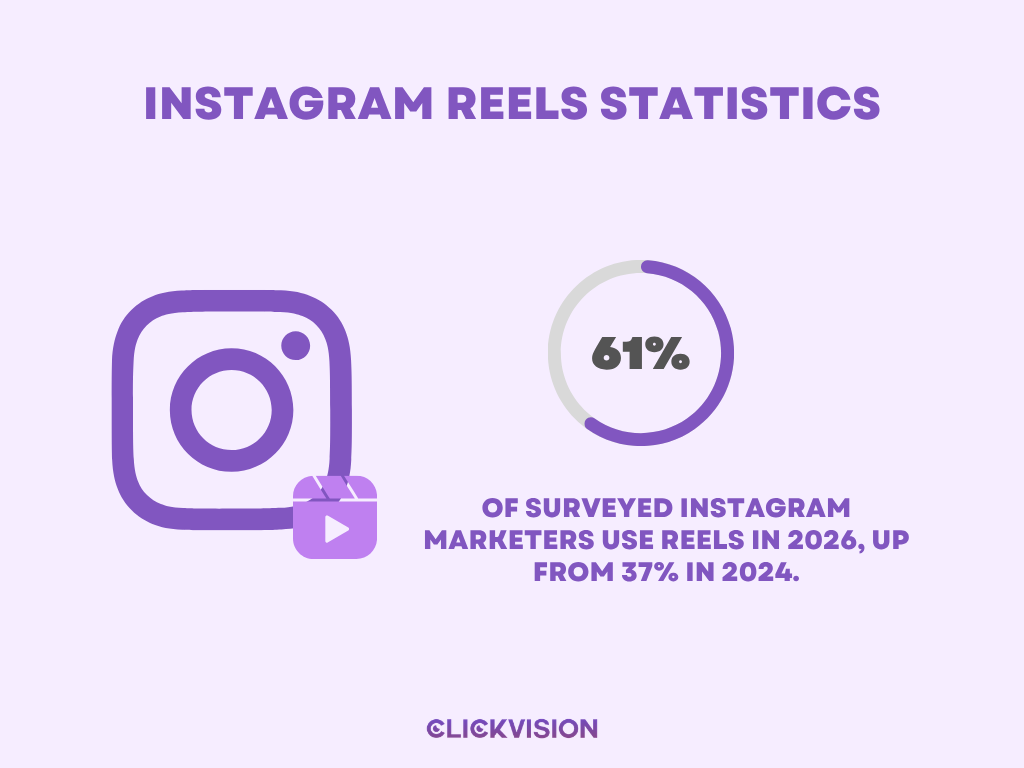
Marketer adoption has also risen sharply. HubSpot found that:
- 61% of surveyed Instagram marketers use Reels in 2026, up from 37% in 2024.
Metricool’s content-performance data reinforces the format’s role:
- Reels generated more than four times the interactions of single-image posts.
- Approximately 65% of a Reel’s views arrive during its first 72 hours.
- Around 61% of Reel interactions also occur during those first 72 hours.
However, strong interaction volume does not mean Reel engagement rates are rising across every benchmark. Socialinsider found that:
- Reels averaged a 0.48% engagement rate in Q2 2026, down from 0.50% in Q1 2026.
- Brands increased their Reels posting volume by 33% year over year in its 2025 benchmark.
Reels are therefore receiving more investment and can produce substantial interaction volume, even while benchmark engagement rates face pressure as brands publish more of them.
Instagram Reels also sit within a much larger video-marketing landscape rather than competing only against other Instagram formats. Readers comparing platform-specific video research can continue with our YouTube marketing statistics.
Instagram Stories Statistics
Stories remain widely used by marketers even though they serve a different purpose from discovery-oriented formats such as Reels.
According to HubSpot’s 2026 survey:
54%
of surveyed Instagram marketers use Stories
25%
publish Stories multiple times per day
23%
publish Stories multiple times per week
These figures show that Stories remain part of regular publishing workflows, especially for marketers using Instagram for frequent audience interaction rather than relying only on permanent feed content.
Instagram Audience Growth Statistics
Growing an Instagram audience is still possible, but the data shows that growth becomes progressively harder as accounts get larger.
HubSpot found that:
- 53% of surveyed Instagram marketers say follower growth is their biggest Instagram challenge.
- 40% report that their follower count was largely unchanged over the previous year.
- Among marketers comparing the two, 56% say organic content performs better for follower growth, compared with 44% who favor paid content.
- 78% of surveyed marketers have successfully grown a brand account to 1,000 followers.
Follower losses are also linked to content and account-quality issues:
- 36% of surveyed Instagram marketers say being too sales-focused has caused them to lose followers.
- 22% of social media marketers cite an inconsistent aesthetic or brand voice as a reason followers leave.
- 21% of marketers reported losing followers after Instagram removed bot accounts.
Metricool’s 2026 account-level data shows how growth varies by follower count:
- Across the study, 8.93% of accounts moved into a higher follower-size category.
- Among accounts with fewer than 2,000 followers, 10.13% moved into a higher category.
- Accounts with 2,000–10,000 followers had the highest progression rate at 10.71%.
- Only 3.13% of accounts with 10,000–100,000 followers moved into the next category.
- Among accounts with 100,000–1 million followers, just 1.34% moved into a higher follower bracket.
The pattern does not mean large Instagram accounts cannot grow. It shows that moving into the next size category becomes less common as the threshold becomes larger.
Instagram Advertising Statistics
Instagram’s advertising reach is substantial, but ad-audience numbers should not be confused with active-user totals.
DataReportal, using Meta’s advertising resources, reported that:
- Instagram ads could reach 1.74 billion users worldwide in January 2025.
- Potential Instagram ad reach increased by 90.8 million users between January 2024 and January 2025.
- That represents a 5.5% year-over-year increase.
- Instagram’s advertising audience equaled 21.3% of the total global population.
- Among people aged 13 and older, potential Instagram ad reach represented 26.9% of the global population.
- Instagram ads could reach 28.8% of adults aged 18 and older worldwide.
- Potential ad reach was equivalent to 31.3% of the world’s internet-user population.
Again, those are advertising-reach estimates rather than monthly active user figures.
HubSpot’s marketer survey shows how paid media fits into actual Instagram strategies:
- 36% of surveyed Instagram marketers use paid content, including advertising and influencer partnerships.
- Looking at the overall content approach, 32% rely primarily on organic content, 36% primarily on paid content, and 32% use a mix of both.
The nearly even split between organic-only and mixed approaches suggests there is no single dominant distribution model among the surveyed marketers. Instagram is only one part of that wider paid-and-organic channel mix, so readers comparing its role with other platforms may also find the broader social media marketing statistics useful.
Instagram Shopping and Social Commerce Statistics
Instagram has built substantial commerce functionality, but marketer adoption of its native shopping tools remains relatively limited.
Two statistics illustrate that gap:
- About 47% of U.S. social buyers are expected to shop on Instagram in 2026, according to eMarketer data reported by Hootsuite.
- Yet only 17% of surveyed Instagram marketers actively use Instagram shopping tools, according to HubSpot’s 2026 report.
The first figure is a 2026 projection for U.S. social buyers, while the second measures adoption among surveyed marketers globally. They describe different populations and should not be read as contradictory. Instagram’s shopping features represent one part of a much wider digital commerce environment. For broader research around how online selling and marketing intersect, see our eCommerce marketing statistics.
Instagram ROI and Conversion Statistics
ROI figures are especially sensitive to survey design because marketers can define return differently. HubSpot’s findings are therefore best read as reports from its surveyed marketer sample rather than universal Instagram conversion benchmarks.
According to the 2026 survey:
- 40% of surveyed Instagram marketers say direct audience interaction produces the most ROI, including activities such as replying to comments and creating interactive Stories.
- 54% of survey respondents say product- or service-focused content delivers their highest ROI.
- 30% say educational or informational content generates their highest ROI.
- 26% say funny content delivers their highest ROI.
- 20% of surveyed Instagram marketers identify increasing revenue as their main Instagram goal.
- Among marketers reporting on clicks from shopping or linked posts, 23% say between 25% and 50% of those clicks convert into purchases.
The last figure needs particularly careful wording. It does not mean Instagram universally converts 25%–50% of clicks into sales. It means 23% of the surveyed marketers reported conversion performance within that range for their shopping or linked posts.
What the Instagram Marketing Statistics Show
Instagram enters 2026 with enormous audience scale, but the performance data does not support a simple “post more Reels and engagement will rise” formula. Brands are publishing more content, Reels adoption continues to increase, and overall views and interactions can rise even while engagement-rate benchmarks decline.
The strongest pattern across the data is specialization. Reels are heavily used for discovery and interaction, carousels perform strongly for saves, Stories remain part of frequent audience communication, and organic content still plays an important role in follower growth. At the same time, Instagram’s advertising audience, shopping potential, and marketer investment make paid distribution an established part of the platform rather than a separate strategy.
The numbers also show why methodology matters. An engagement rate from one benchmark cannot automatically replace another, an advertising audience is not the same as monthly active users, and a survey of Instagram marketers cannot be generalized to every brand on the platform. Keeping those distinctions intact produces a smaller set of statistics, but a far more useful one.