
Small business owners often juggle tight budgets, limited time, and growing competition for customer attention. Small business marketing statistics offer a closer look at these challenges and how different businesses approach them. Yet choosing the right marketing channels and knowing what works can still be difficult. Customer expectations also vary, making it harder to decide where to focus limited resources.
Looking at recent research can help put these decisions into perspective. This article brings together small business marketing data on budgets, strategies, SEO, social media, email, AI, and customer behavior. You’ll also find insights into marketing performance, customer acquisition, and the challenges businesses face when trying to grow.
Key Takeaways
Marketing planning is associated with better reported results. In a 2024 survey, 87% of small businesses with a marketing plan reported success, compared with 13% of those without one.
Many small businesses struggle to evaluate their marketing. Constant Contact found that 73% of surveyed SMB decision-makers lacked confidence that their marketing strategy was working in 2024.
Marketing budgets remain an important consideration. According to SimpleTexting’s 2024 research, 63% of surveyed small businesses planned to increase their marketing budgets over the following year.
Websites remain important for customer trust and acquisition. In Wix/VistaPrint’s 2025 survey, 81% of consumers considered a branded business website important, while 42% would look elsewhere if they couldn’t find one.
Social media plays a major role in customer discovery. Constant Contact’s 2026 research found that 49% of surveyed consumers discovered new small businesses through social media, compared with 40% through search engines.
Small Business Marketing Strategy Statistics
The following findings describe reported marketing practices, planning, and confidence. Survey responses measure perceptions and reported activity, not independently established campaign performance.
- 44% of surveyed small-business respondents identified their website as their most influential marketing channel. (SimpleTexting; 2024)
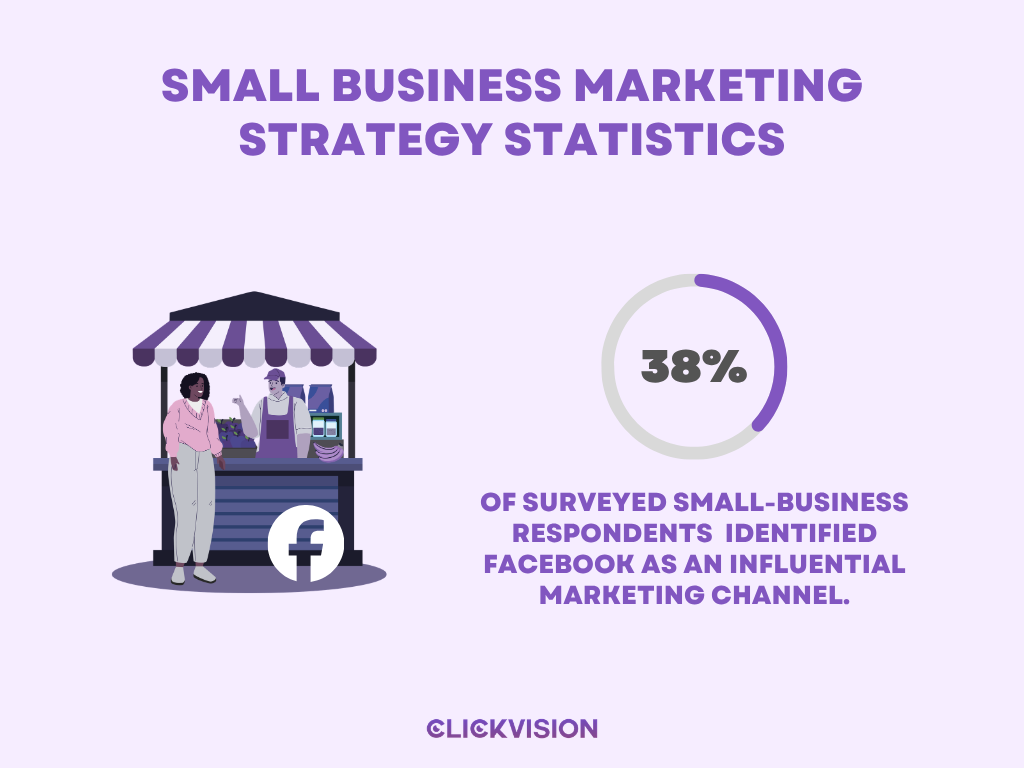
- 38% identified Facebook as an influential marketing channel. (SimpleTexting; 2024)
- 28% reported using search engine marketing. (SimpleTexting; 2024)
- 23% reported using blogging as a marketing tactic. (SimpleTexting; 2024)
- 17% reported using SEO to improve online visibility. (SimpleTexting; 2024)
- 43.5% of small businesses reported actively seeking to influence online customer reviews. (SimpleTexting; 2024)
- 75% of surveyed small businesses had a marketing plan. (SimpleTexting; 2024)
- 25% did not have a marketing plan. (SimpleTexting; 2024)
- 87% of businesses with a marketing plan reported marketing success. (SimpleTexting; 2024)
- 13% of businesses without a marketing plan reported marketing success. (SimpleTexting; 2024)
- 73% of surveyed SMB decision-makers lacked confidence that their marketing strategy was working. (Constant Contact; 2024)
- 39% expected to increase marketing budgets in 2024. (Constant Contact; 2024)
- 37% considered choosing the right marketing channels their biggest opportunity to improve. (Constant Contact; 2024)
- 41% planned to increase the number of marketing channels used in 2024. (Constant Contact; 2024)
- 82% agreed that using multiple marketing channels leads to better results. (Constant Contact; 2024)
- 16% were confident that they were using the right marketing channels to reach customers. (Constant Contact; 2024)
Small Business Marketing Budget Statistics
Spending percentages and future investment plans refer to different surveys and timeframes. A planned increase should not be described as money already spent.
Planned Changes in Marketing Spending
- 78% planned to increase digital-marketing spending
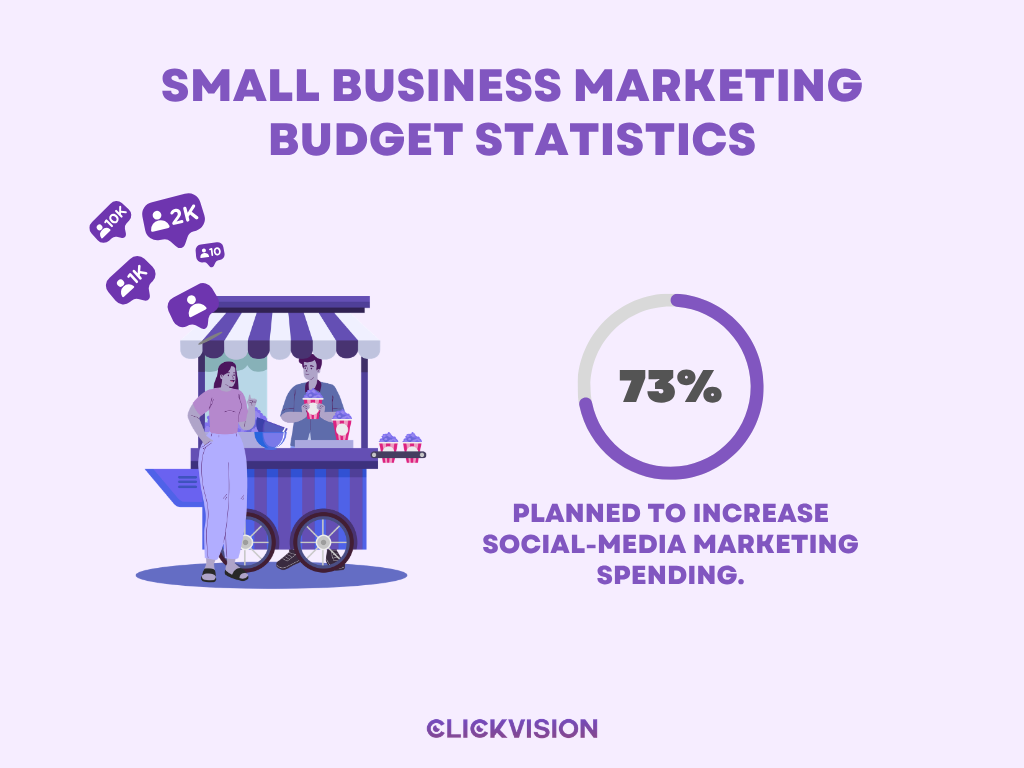
- 73% planned to increase social-media marketing spending.
- 57% planned to increase email-marketing spending.
- 19% planned to decrease traditional-marketing spending.
- 11% planned to decrease event-marketing spending.
Planned Changes in Marketing Spending
- 10% planned to decrease email-marketing spending.
- 8% planned to decrease social-media marketing spending.
- 36% planned to maintain traditional-marketing spending.
- 33% planned to maintain email-marketing spending.
- 33% planned to maintain event-marketing spending.
- 34% planned to expand digital-marketing efforts during the next 12 months. (Wix/VistaPrint; 2025)
- 44% of surveyed businesses allocated 6–10% of their overall budget to marketing. (Original/secondary research; 2024)
- 48% of businesses allocating 6–10% of their overall budget to marketing reported marketing success. (Original/secondary research; 2024)
- 11% of businesses allocating less than 5% of their overall budget to marketing reported marketing success. (Original/secondary research; 2024)
- 63% planned to increase their marketing budget over the following 12 months. (Original/secondary research; 2024)
- 80% of surveyed technology-sector small businesses planned to increase marketing budgets. (Original/secondary research; 2024)
- 80% of surveyed human-resources-sector small businesses planned to increase marketing budgets. (Original/secondary research; 2024)
- 76% of surveyed finance-sector small businesses planned to increase marketing budgets. (Original/secondary research; 2024)
Small Business Marketing Team and Time Statistics
Staffing findings from Campaign Monitor are historical; the other surveys describe different business populations and should not be combined into one average.
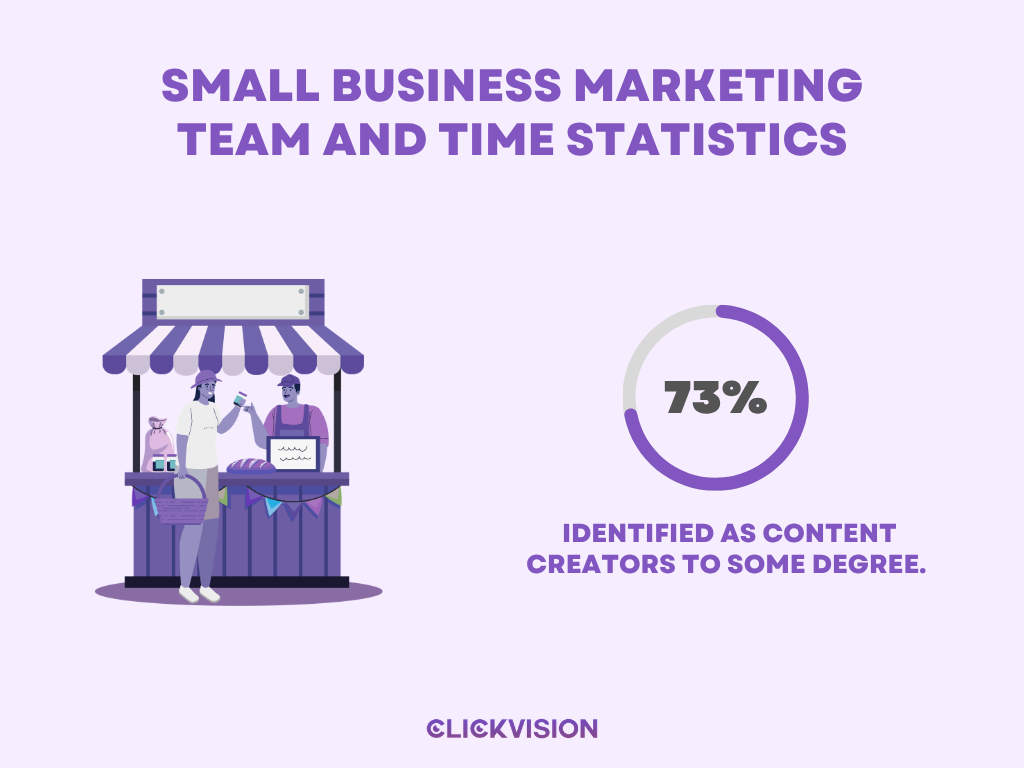
- 73% identified as content creators to some degree. (Constant Contact; 2026)
- 47% handled all their social media management independently. (Constant Contact; 2026)
- 56.9% had dedicated in-house marketing staff. (Campaign Monitor; 2019)
- 20.8% assigned marketing to employees who also had other roles. (Campaign Monitor; 2019)
- 15.3% relied on the owner to conduct all marketing. (Campaign Monitor; 2019)
- 4.8% outsourced marketing to an agency. (Campaign Monitor; 2019)
- 2.2% used freelancers or contractors for marketing. (Campaign Monitor; 2019)
- 42% of small businesses combined in-house marketing with external professional services. (SimpleTexting; 2024)
- 75% of respondents at businesses with 10 or more marketing employees were confident in a positive marketing ROI. (SimpleTexting; 2024)
- 30% of respondents at businesses with one marketing employee were confident in positive marketing ROI. (SimpleTexting; 2024)
- 6% of respondents at businesses with no dedicated marketers were confident in positive marketing ROI. (SimpleTexting; 2024)
- 56% had an hour or less per day to spend on marketing. (Constant Contact; 2024)
- 52% routinely put off marketing in favor of other tasks. (Constant Contact; 2024)
- 51% cited social posting as a particularly time-consuming marketing task. (Constant Contact; 2024)
- 40% cited planning and strategy as time-consuming. (Constant Contact; 2024)
- 35% cited determining what worked as time-consuming. (Constant Contact; 2024)
Small Business Digital Marketing and SEO Statistics
These figures concern small businesses’ reported online presence and search-related activity. Perceived performance should not be read as audited ROI.
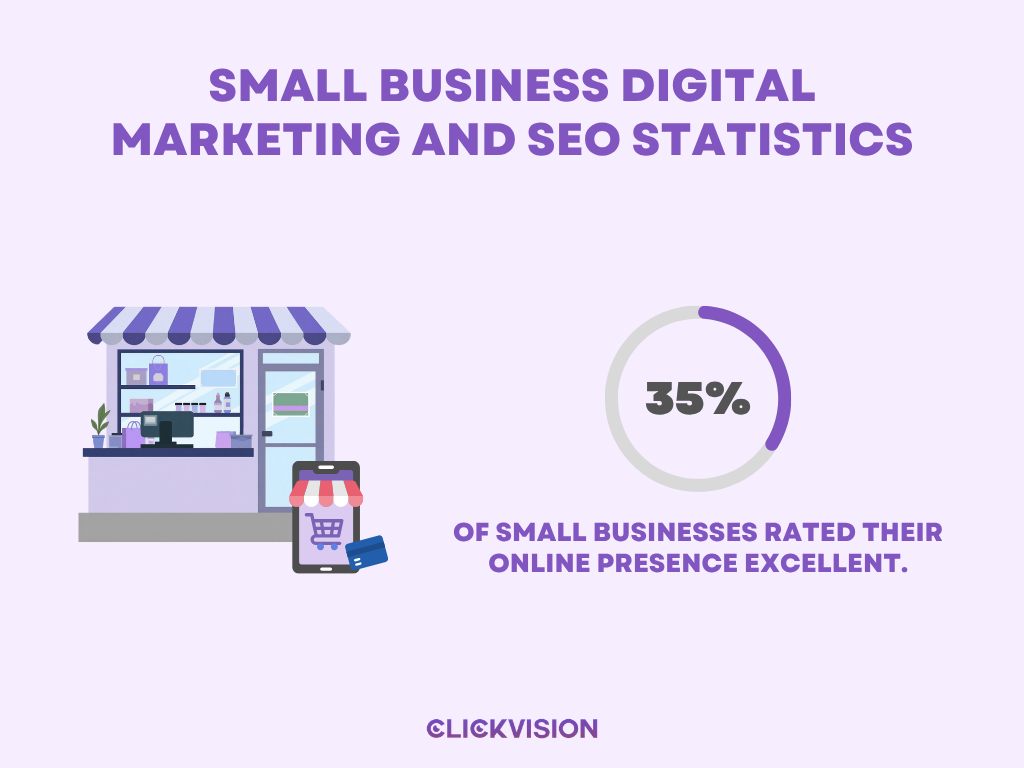
35%
of small businesses rated their online presence excellent.
31%
rated their online presence good.
19%
rated their online presence average.
- 56% with an excellent online presence were highly confident in their marketing ROI. (SimpleTexting; 2024)
- 1% with a poor online presence were highly confident in their marketing ROI. (SimpleTexting; 2024)
- 57% with an excellent online presence said marketing had a very significant sales impact. (SimpleTexting; 2024)
- 2% with a poor online presence said marketing had a very significant sales impact. (SimpleTexting; 2024)
- 19% used local SEO and Google My Business for local visibility. (SimpleTexting; 2024)
An adoption percentage cannot tell a business whether search is worth prioritizing. The importance of SEO for small businesses is clearer when considering search intent, local visibility, and the resources needed to maintain an organic presence.
Local businesses also need to distinguish broad organic search from location-based discovery, where proximity and business information affect what customers find. Our local SEO statistics explore that narrower search landscape.
Small Business Website Statistics
The website findings draw on U.S. owner and consumer surveys. Customer perceptions are distinct from website adoption among businesses.
- 81% considered having a branded business website important. (Wix/VistaPrint; 2025)
- 15% said the absence of a business website would be a dealbreaker. (Wix/VistaPrint; 2025)
- 42% would look elsewhere if they could not find a business website. (Wix/VistaPrint; 2025)
- 14% would doubt that a business was legitimate if they could not find its website. (Wix/VistaPrint; 2025)
- Among owners who called websites essential/important for growth, 62% identified customer acquisition as a benefit. (Wix/VistaPrint; 2025)
- Among owners who called websites essential/important for growth, 48% identified improved credibility as a benefit. (Wix/VistaPrint; 2025)
- 6% said having a website was not important. (Wix/VistaPrint; 2025)
Small Business Social Media Marketing Statistics
Consumer discovery statistics are separate from business marketing adoption. The platform adoption figures below are from Campaign Monitor’s 2019 survey, not 2026.
- 49% reported discovering new small businesses through social media. (Constant Contact; 2026)
- 40% reported discovering new small businesses through search engines. (Constant Contact; 2026)
- 69.6% reported using Facebook as a marketing channel. (Campaign Monitor; 2019)
- 64.1% reported using email marketing as a marketing channel. (Campaign Monitor; 2019)
- 52.4% reported using direct mail as a marketing channel. (Campaign Monitor; 2019)
- 48.3% reported using Instagram as a marketing channel. (Campaign Monitor; 2019)
- 47.0% reported using Twitter as a marketing channel. (Campaign Monitor; 2019)
- 45.7% reported using print advertising as a marketing channel. (Campaign Monitor; 2019)
- 42.8% reported using paid search as a marketing channel. (Campaign Monitor; 2019)
- 27.3% reported using Snapchat as a marketing channel. (Campaign Monitor; 2019)
- 24.5% reported using billboards or other out-of-home advertising as a marketing channel. (Campaign Monitor; 2019)
- 23.6% reported using music-streaming advertising as a marketing channel. (Campaign Monitor; 2019)
- 18.8% reported using podcast programming as a marketing channel. (Campaign Monitor; 2019)
- 18.5% reported using podcast advertising as a marketing channel. (Campaign Monitor; 2019)
A channel’s adoption rate says little about how people engage with it or whether businesses pay to reach them. The wider social media marketing statistics landscape helps separate platform usage, advertising activity, and audience behavior.
Small Business Content Marketing Statistics
The blogging finding is a relative comparison, not a claim that blogging produces a fixed percentage return.
- Small businesses were 23% more likely than average to report ROI from blog posts. (HubSpot; 2026)
Small Business Email, SMS and Customer Communication Statistics
Email adoption, frequent use and preferred communication channels measure different behaviors. The detailed communication-channel breakdown is from 2019.
- 53% of surveyed small-business owners said email marketing was their most frequent strategy to attract new customers and retain existing ones. (HubSpot; 2024)
- 71.8% used email regularly to communicate with customers. (Campaign Monitor; 2019)
- 60.8% used Facebook regularly to communicate with customers. (Campaign Monitor; 2019)
- 55.8% used phone regularly to communicate with customers. (Campaign Monitor; 2019)
- 47.6% used direct mail regularly to communicate with customers. (Campaign Monitor; 2019)
- 39.9% used Instagram regularly to communicate with customers. (Campaign Monitor; 2019)
- 39.8% used Twitter regularly to communicate with customers. (Campaign Monitor; 2019)
- 33.3% used SMS regularly to communicate with customers. (Campaign Monitor; 2019)
- 31.3% used web chat regularly to communicate with customers. (Campaign Monitor; 2019)
- 31% used company blogs regularly to communicate with customers. (Campaign Monitor; 2019)
Small Business AI Marketing Statistics
AI adoption varies by survey, business population and definition. Platform-specific time savings should not be generalized to all small businesses.
- 26% used AI tools in 2023 in the study comparison. (Constant Contact; 2026)
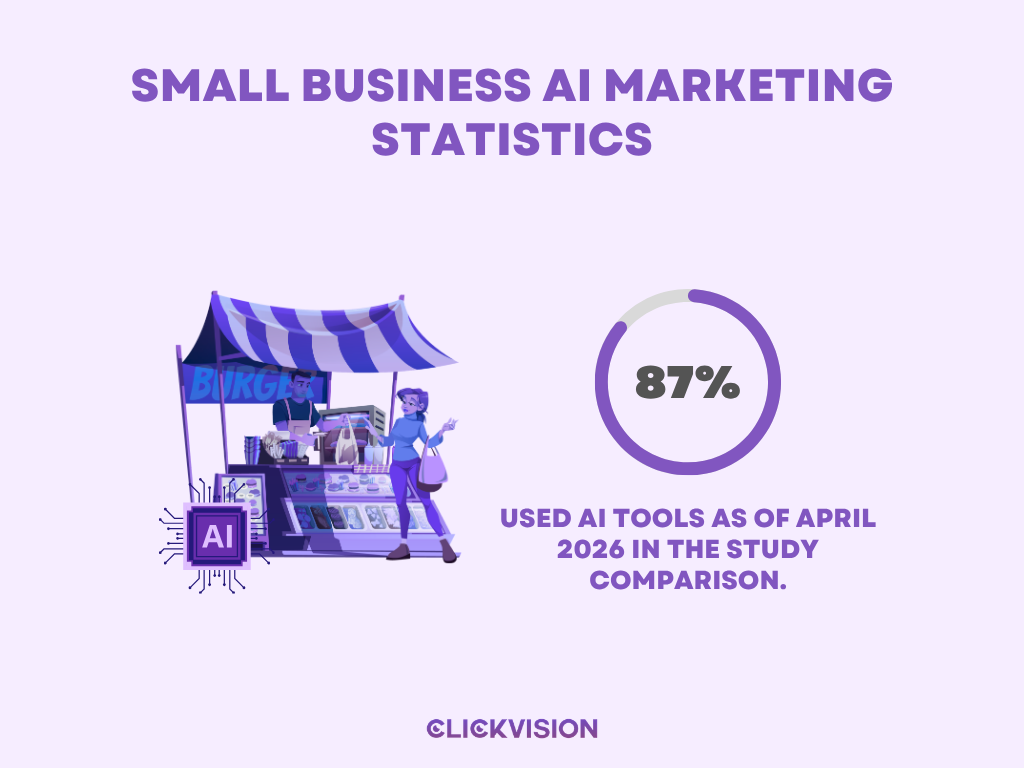
- 87% used AI tools as of April 2026 in the study comparison. (Constant Contact; 2026)
- 40% of small businesses used AI or automation to help handle marketing workloads. (Constant Contact; 2026)
- 50% of AI users reported time saving as the primary benefit. (Constant Contact; 2026)
- 42% of owners reported using AI to write copy or content. (Constant Contact; 2026)
- 38% of owners reported using AI to analyze data. (Constant Contact; 2026)
- Constant Contact observed up to 23% less time needed for campaign and email creation with its built-in AI tools. (Constant Contact; 2026)
- 46% of surveyed shoppers wanted brands to label AI-generated content explicitly. (Constant Contact; 2026)
- 37% of surveyed businesses reported already disclosing their use of automated tools such as chatbots. (Constant Contact; 2026)
- 55% were using AI tools. (Wix/VistaPrint; 2025)
- 45% were not using AI tools. (Wix/VistaPrint; 2025)
- Among AI non-users, 65% were interested in using it. (Wix/VistaPrint; 2025)
- Among AI non-users, 21% were undecided about using it. (Wix/VistaPrint; 2025)
- 75% frequently or always incorporated customer feedback into their marketing strategies. (SimpleTexting; 2024)
- 49% of businesses consistently incorporating customer feedback reported marketing success. (SimpleTexting; 2024)
- 1% of businesses not incorporating customer feedback reported marketing success. (SimpleTexting; 2024)
- 59% incorporated AI into marketing strategy. (SimpleTexting; 2024)
AI use for writing and analysis should not be mistaken for proven customer acquisition. Lead qualification, personalization, and follow-up are separate applications, explored more closely in our AI lead generation statistics.
Small Business Customer Acquisition and Shopping Statistics
These are predominantly consumer-reported preferences and discovery patterns, not a measurement of actual sales attributable to marketing.
- 10% preferred shopping primarily at small businesses in 2021. (Constant Contact; 2026)
- 27% preferred shopping primarily at small businesses in 2026. (Constant Contact; 2026)
- 47% preferred shopping primarily at large corporations in 2021. (Constant Contact; 2026)
- 33% preferred shopping primarily at large corporations in 2026. (Constant Contact; 2026)
- 49% reduced their spending at small businesses amid inflation and rising costs. (Constant Contact; 2026)
- 62% struggled to choose between comparable small businesses. (Wix/VistaPrint; 2025)
- 36% reported shopping at small businesses more often than a year earlier. (Wix/VistaPrint; 2025)
- 59% reported shopping at small businesses about as often as a year earlier. (Wix/VistaPrint; 2025)
- 5% reported shopping at small businesses less often than a year earlier. (Wix/VistaPrint; 2025)
- 64% preferred shopping in person. (Wix/VistaPrint; 2025)
- 55% of Gen Z respondents preferred shopping online. (Wix/VistaPrint; 2025)
- 83% of Baby Boomer respondents preferred shopping in person. (Wix/VistaPrint; 2025)
- 72% of surveyed consumers preferred purchasing from small businesses rather than large enterprises. (SimpleTexting; 2024)
- 44% intentionally increased purchasing at small businesses over the previous year. (SimpleTexting; 2024)
- 48% shopped at small businesses monthly. (SimpleTexting; 2024)
- 28% shopped at small businesses weekly. (SimpleTexting; 2024)
- 38% most commonly discovered new small businesses through word of mouth. (SimpleTexting; 2024)
- 31% most commonly discovered small businesses through social media. (SimpleTexting; 2024)
- 50% cited product quality as their top priority when purchasing from small businesses. (SimpleTexting; 2024)
- 28% cited price as their top priority when purchasing from small businesses. (SimpleTexting; 2024)
- 9% cited customer service as their top priority when purchasing from small businesses. (SimpleTexting; 2024)
The generational shopping split is another reason to avoid treating consumer preferences as uniform. Our Gen Z marketing statistics offer a closer look at this younger audience without assuming its preferences represent every shopper.
Shopping online and discovering a business online are separate behaviors, and neither guarantees an online purchase. Ecommerce statistics provide a more direct lens on digital purchasing activity than discovery preferences alone.
Small Business Customer Retention and Loyalty Statistics
The results describe what consumers say matters for repeat purchases and which retention strategies businesses report prioritizing.
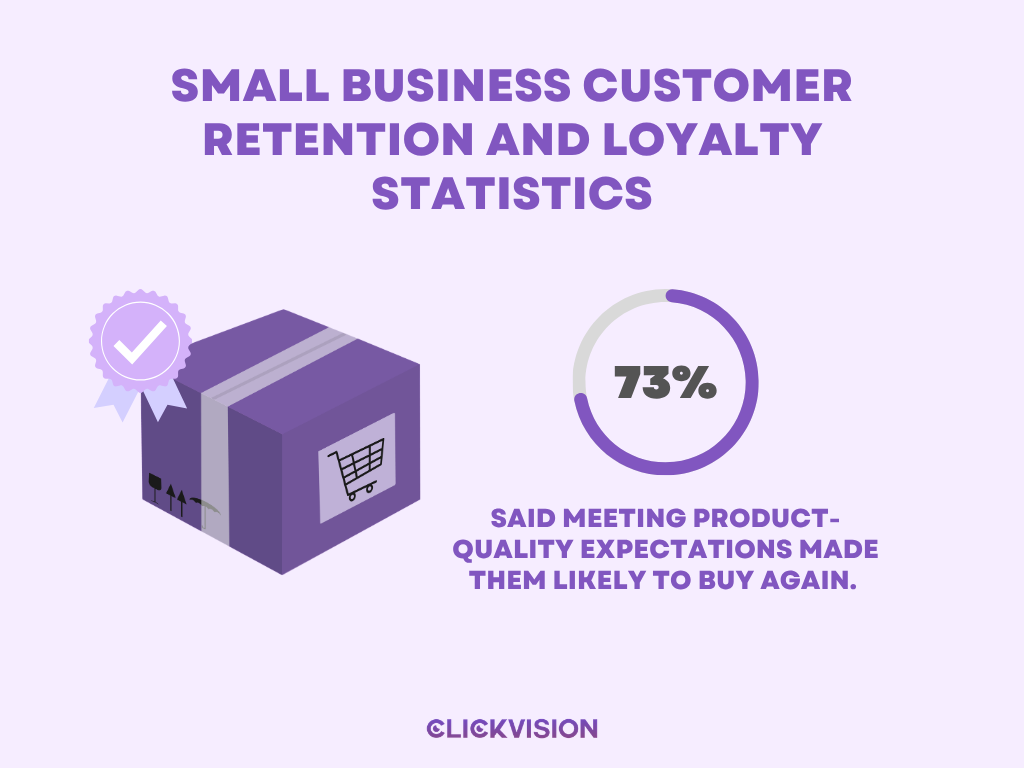
- 73% said meeting product-quality expectations made them likely to buy again. (Wix/VistaPrint; 2025)
- 57% said location and convenience mattered for repeat purchases. (Wix/VistaPrint; 2025)
- 47% said customer support mattered for repeat purchases. (Wix/VistaPrint; 2025)
- 52% of owners focused on social-media engagement as a loyalty tactic. (Wix/VistaPrint; 2025)
- 38% of consumers said social media brought them back to a brand. (Wix/VistaPrint; 2025)
- 60% of consumers valued loyalty programs. (Wix/VistaPrint; 2025)
- 37% of businesses focused on loyalty programs. (Wix/VistaPrint; 2025)
- 37% of consumers said they returned seeking branded merchandise. (Wix/VistaPrint; 2025)
Small Business Traditional and Offline Marketing Statistics
Offline discovery and community preferences remain relevant, but these findings do not establish which channel is most profitable.
- 45% discovered new businesses through direct mail. (Wix/VistaPrint; 2025)
- 36% said television or radio ads helped them discover businesses. (Wix/VistaPrint; 2025)
- 62% liked receiving a promotional T-shirt. (Wix/VistaPrint; 2025)
- 47% of surveyed businesses offered promotional T-shirts. (Wix/VistaPrint; 2025)
- 63% wanted businesses to support community causes and events more. (Consumer survey; Wix/VistaPrint; 2025)
- 55% wanted more collaboration among small businesses. (Consumer survey; Wix/VistaPrint; 2025)
Small Business Customer Marketing Preferences Statistics
Consumer responses can inform marketing decisions, but should not be restated as small-business adoption or performance rates.
- 38% preferred email for marketing communications from small businesses. (SimpleTexting; 2024)
- 34% preferred social media for marketing communications from small businesses. (SimpleTexting; 2024)
- 64% said it was important or very important that small businesses maintain a strong online presence. (SimpleTexting; 2024)
- 81% were most likely to engage with small-business marketing messages featuring discounts and promotions. (SimpleTexting; 2024)
- 40.7% were interested in new product announcements. (SimpleTexting; 2024)
- 37.1% were interested in testimonials and customer stories. (SimpleTexting; 2024)
- 54% reported having left an online review for a small business. (SimpleTexting; 2024)
- 64% said online reviews influenced a decision to support a small business during the previous year. (SimpleTexting; 2024)
- 27% said AI usage made them more likely to shop from small businesses. (SimpleTexting; 2024)
- 39% favored AI uses that streamlined checkout and payment security. (SimpleTexting; 2024)
- 33% valued AI personalization of their shopping experience. (SimpleTexting; 2024)
- 28% valued AI-assisted appointment or reservation scheduling. (SimpleTexting; 2024)
- 47% expressed concerns about how AI systems use their data. (SimpleTexting; 2024)
- 45% were concerned AI would increase prices. (SimpleTexting; 2024)
- 44% were concerned AI could replace human jobs. (SimpleTexting; 2024)
Small Business Marketing Challenges and ROI Statistics
Where respondents ranked marketing channels, those rankings indicate perception, not measured ROI or causal effectiveness.
- Social media ranked as the largest perceived opportunity to build brand awareness. (Campaign Monitor; 2019)
- Social media ranked as the largest perceived opportunity to acquire customers. (Campaign Monitor; 2019)
- Customer acquisition ranked as their largest marketing challenge and top marketing goal. (Campaign Monitor; 2019)
- Influencer marketing ranked as the most difficult channel to use. (Campaign Monitor; 2019)
- Email marketing ranked highest for perceived return on marketing investment. (Campaign Monitor; 2019)
- 60% cited new-customer acquisition as a top marketing challenge. (Constant Contact; 2024)
- 33% cited understanding what was working as a marketing challenge. (Constant Contact; 2024)
- 32% cited lack of resources as a marketing challenge. (Constant Contact; 2024)
Research scope and interpretation
This collection preserves separately reported findings instead of inventing combined averages. Survey respondents, business-size definitions, geographic coverage, and reporting periods are not interchangeable. Some original-study detail is still unavailable, so these are attributed statistics rather than uniformly independently verified results.
Older findings, especially the 2019 Campaign Monitor survey, are included for historical reference only. Consumer preferences are not a proxy for small-business marketing adoption, and self-reported success or confidence does not establish independently measured return on investment.
The article intentionally excludes unsupported fixed-return claims such as a universal $13 return for every $1 spent on local SEO. Seven additional figures remain on editorial hold due to source wording, subgroup denominator or methodology concerns and have not been published here.
Sources and research references
Conclusion
Small business marketing statistics reveal how differently businesses approach customer acquisition, spending, and marketing performance. While digital channels and AI offer new opportunities, limited budgets, time constraints, and uncertainty about results remain common challenges. The findings also show why marketing decisions should reflect each business’s audience, resources, and goals rather than general industry trends.
Ultimately, these statistics provide valuable context for evaluating marketing strategies and identifying areas worth exploring. Comparing research from different years and business populations helps put the findings into perspective. With a clearer view of marketing practices and customer expectations, small businesses can make more informed decisions about where to focus their efforts.