
Influencer marketing has become an established part of how brands reach consumers, introduce products, and build relationships with online audiences. As businesses invest more in creator partnerships, questions about campaign costs, measurable returns, and consumer trust have become increasingly important.
The latest influencer marketing statistics reveal how the industry is changing in 2026. This collection brings together findings from Aspire, Sprout Social, CreatorIQ, Statista, Linqia, IZEA, and other research organizations. It covers market growth, budgets, consumer purchasing behavior, engagement, creator compensation, social commerce, and AI adoption.
Key Influencer Marketing Statistics
Here are some of the most significant findings from recent influencer marketing research.
- The global influencer marketing industry was estimated to reach $32.55 billion in 2025. (Statista)
- 74% of marketers surveyed by Aspire planned to increase their influencer marketing budgets in 2026. (Aspire)
- 71% of organizations surveyed by CreatorIQ increased their creator marketing investment year over year. (CreatorIQ)
- 86% of consumers in Sprout Social’s 2025 research reported making at least one influencer-inspired purchase annually. (Sprout Social)
- 69% of marketers in research reported by Aspire said influencer-generated content performs better than brand-directed content. (Aspire)
- 77% of marketers surveyed by Aspire repurpose creator content in paid advertisements. (Aspire)
- 59% of marketers surveyed by Aspire use AI in influencer marketing operations. (Aspire)
- 57% of brands surveyed by Aspire already sell through TikTok Shop or plan to begin doing so. (Aspire)
- Aspire creators generated more than $52 million in attributed affiliate sales in 2025, representing 45% annual growth. (Aspire)
- 79% of enterprise marketers surveyed by Linqia reported difficulty measuring influencer marketing ROI. (Linqia)
These statistics represent findings from different studies, survey populations, and measurement periods. They should not be interpreted as results from one global survey.
Influencer Marketing Industry Growth Statistics
The expansion of influencer marketing has attracted larger budgets, more established companies, and increasing attention from marketing leadership. Recent research illustrates how creator partnerships have developed into a substantial advertising and marketing category.
- The global influencer marketing industry was valued at approximately $1.7 billion in 2016, according to the historical market-size series reported by Statista. (Sprout Social, citing Statista)
- By 2022, the industry’s estimated value had reached $16.4 billion. (Sprout Social, citing Statista)
- The global influencer marketing market was estimated at $32.55 billion in 2025. This represents an industry-value estimate rather than directly measured global advertising expenditure. (Statista)
- 86% of U.S. marketers partnered with influencers in 2025, according to a Statista finding reported by Sprout Social. (Sprout Social)
- The worldwide number of influencer marketing companies reached 6,939 in 2025, according to Statista’s industry dataset. (Statista)
Although the figures demonstrate substantial historical expansion, market-size estimates should be distinguished from spending on influencer advertisements, creator payments, or the broader creator economy. These categories do not measure exactly the same activity.
Influencer Marketing Budget and Spending Statistics
Budget allocation is one of the clearest indicators of how organizations prioritize influencer partnerships. Recent surveys show continued interest in increasing expenditure, although investment levels differ considerably across businesses.
- 74% of marketers in Aspire’s 2026 research planned to increase their influencer marketing budgets. (Aspire)
- 62% of enterprise marketers surveyed by Linqia planned to increase their influencer marketing budgets in 2026. (Linqia)
- 33% of Linqia’s enterprise respondents planned to spend more than $5 million on influencer marketing. (Linqia)
- 71% of organizations surveyed in CreatorIQ’s 2025–2026 State of Creator Marketing report increased creator marketing investment year over year. (CreatorIQ)
- Average reported annual influencer marketing budgets among CreatorIQ’s surveyed organizations increased 171% year over year. This is a surveyed-budget finding, not the growth rate of the entire influencer marketing market. (CreatorIQ)
- Nearly two-thirds of organizations increasing creator investment in CreatorIQ’s research redirected spending from traditional paid and digital marketing channels. (CreatorIQ)
- 26% of surveyed marketing agencies and brands worldwide allocated more than 40% of their marketing budgets to influencer marketing, while 17.8% allocated less than 10%. (Sprout Social, citing Statista’s January 2025 data)
The differences between Aspire’s 74%, Linqia’s 62%, and CreatorIQ’s 71% reflect separate studies and respondent populations. They are not competing estimates of one universal percentage.
Influencer Marketing Effectiveness Statistics
Marketers increasingly evaluate influencer campaigns beyond follower counts and impressions. Research on creator-generated content shows how businesses perceive its performance compared with content produced directly by brands.
- 69% of marketers reported that influencer-generated content performs better than brand-directed content. (Aspire)
- 81% of enterprise marketers surveyed by Linqia said creator content outperforms brand-created assets. (Linqia)
- 92% of marketers in research reported by Sprout Social said sponsored influencer content delivered better reach than organic content published by brands. (Sprout Social)
- 90% of marketers in the same research reported better engagement from sponsored influencer content. (Sprout Social)
- 83% of marketers reported higher conversions from sponsored influencer content compared with organic brand content. (Sprout Social)
- 65% of influencers surveyed by Sprout Social preferred participating in creative or strategy discussions early rather than receiving a rigid brief. (Sprout Social)
92%
reported better reach from sponsored influencer content
90%
reported better engagement from sponsored influencer content
83%
reported higher conversions from sponsored influencer content
These are predominantly self-reported performance comparisons. They indicate how surveyed marketers perceive campaign results, rather than independently establishing that influencer content always generates higher conversions.
Influencer Marketing ROI Statistics
Return on investment remains one of the most important considerations for businesses evaluating creator partnerships. However, survey results reveal that measuring financial outcomes consistently is still difficult.
- 79% of enterprise marketers surveyed by Linqia reported struggling to measure influencer marketing ROI. (Linqia)
- 48% of Linqia’s respondents identified attribution as their biggest measurement gap. (Linqia)
- 50% measured link traffic generated by influencer posts. (Sprout Social)
- 45% monitored increases in website traffic during influencer campaigns. (Sprout Social)
- 49% of enterprise marketers in Linqia’s research worked with specialist influencer marketing agencies. (Linqia)
A frequently repeated claim suggests influencer marketing returns $5.78 for every dollar spent. However, the sources reviewed do not provide sufficient current methodological evidence to establish that figure as a universal industry average.
For meaningful comparisons, brands need to distinguish revenue-based return on investment from return on ad spend, earned media value, engagement, and attributed conversions. These metrics answer different questions and cannot be substituted for one another.
A campaign may generate qualified traffic without producing the expected conversions if the destination page doesn’t match the creator’s recommendation or makes purchasing unnecessarily difficult. Applying appropriate landing page design tactics helps distinguish post-click conversion problems from weaknesses in the influencer campaign itself.
Influencer Marketing Consumer Behavior Statistics
Consumer purchasing behavior provides another perspective on influencer marketing effectiveness. Research from Sprout Social and IZEA examines how frequently audiences act on recommendations and what makes sponsored content more persuasive.
- 86% of consumers surveyed in Sprout Social’s 2025 research reported making at least one purchase inspired by an influencer annually. (Sprout Social)
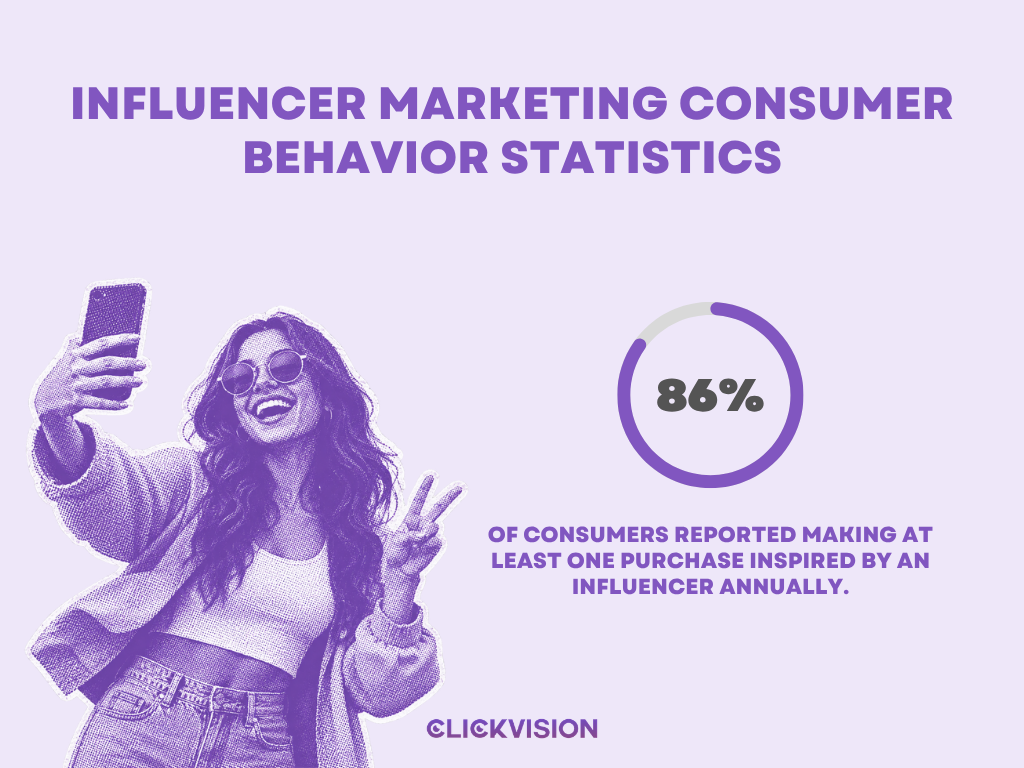
- 49% of consumers in the same research reported making influencer-inspired purchases on a daily, weekly, or monthly basis. (Sprout Social)
- 16% of consumers ranked influencer marketing as having the greatest impact on their purchasing decisions. (Sprout Social)
- 64% of surveyed consumers said genuine creator reviews compelled them to purchase products. (Sprout Social)
- 55% identified discount codes as content that encouraged purchasing. (Sprout Social)
- 67% of surveyed consumers considered honesty and impartiality important qualities of successful brand-influencer collaborations. (Sprout Social)
- 29% of consumers said they were likely to share product feedback directly with influencers. (Sprout Social)
The findings illustrate why brands consider genuine reviews, product demonstrations, and audience trust when choosing creator partnerships. They are self-reported behaviors and preferences rather than independently verified purchase transactions.
Influencer Marketing Trust Statistics
Trust plays a significant role in how audiences perceive creator recommendations, but consumer confidence differs across demographics and research populations.
- 62% of U.S. social media users surveyed by IZEA in December 2022 said they trusted influencers more than A-list celebrities. The study included 1,299 respondents aged 18 and older. (IZEA)
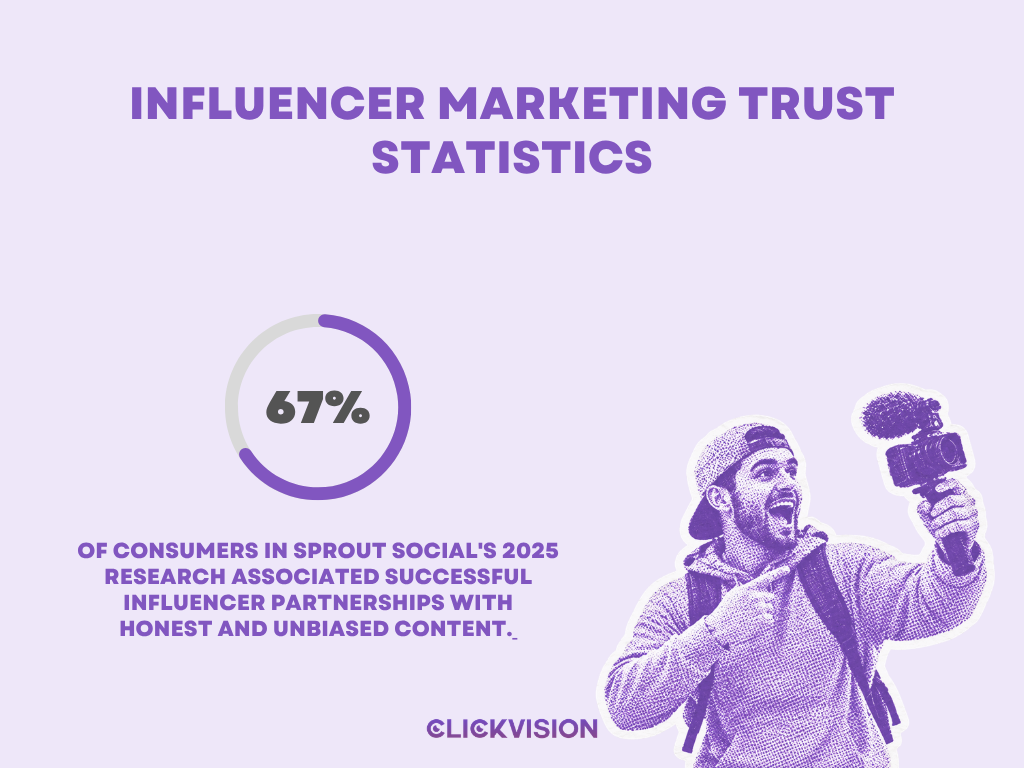
- 67% of consumers in Sprout Social’s 2025 research associated successful influencer partnerships with honest and unbiased content. (Sprout Social)
- Only 17% of consumers in the same 2026 Sprout Social research checked an influencer’s follower count before deciding whether to engage with their content. (Sprout Social)
These findings suggest that creator selection should account for more than audience size. Topic relevance, content style, transparency, and the relationship between creators and their audiences also deserve consideration. Broader social media marketing statistics can provide additional context on audience behavior and engagement across platforms.
Influencer Marketing Statistics by Generation
Different age groups interact with influencers through different platforms and content formats. Generational research helps explain why the same campaign approach may not work equally well for every audience.
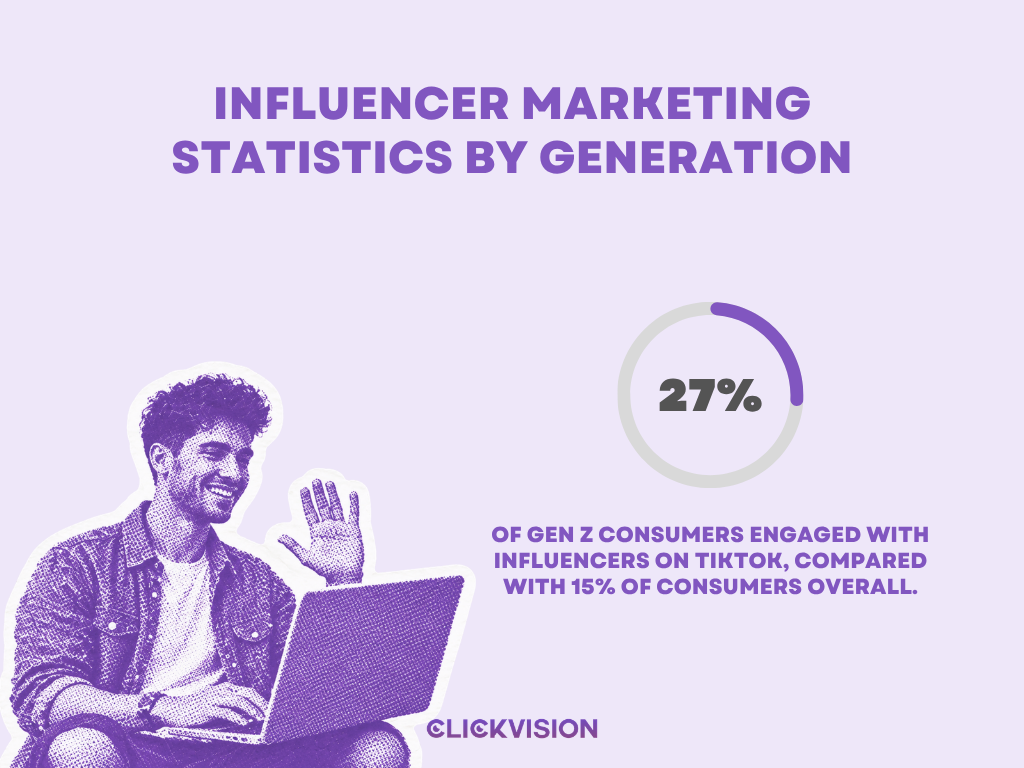
- 27% of Gen Z consumers in Sprout Social’s 2025 research engaged with influencers on TikTok, compared with 15% of consumers overall. (Sprout Social)
- 41% of Gen Z consumers surveyed by Sprout Social said they were likely to share product feedback with influencers. (Sprout Social)
- Among consumers identified as frequent buyers, 62% reported being likely to share product feedback with influencers. (Sprout Social)
- 50% of Baby Boomers in Sprout Social’s reported platform-preference research were most likely to engage with influencers on Facebook. (Sprout Social)
These comparisons reinforce the importance of studying the audience a brand wants to reach instead of selecting influencer platforms solely according to their overall popularity.
Younger consumers may discover products through influencer content but still seek reviews, comparisons, and other opinions before purchasing. This distinction between discovery and purchase validation is particularly relevant when interpreting Gen Z marketing statistics.
Influencer Statistics by Creator Size
Influencers are commonly categorized according to their follower counts, although the exact thresholds can vary between research providers and social media platforms.
| Influencer tier | Common follower range |
| Nano-influencers | 1,000–10,000 |
| Micro-influencers | 10,000–100,000 |
| Mid-tier influencers | 100,000–500,000 |
| Macro-influencers | 500,000–1 million |
| Mega-influencers | More than 1 million |
Shopify’s influencer marketing statistics and creator classifications.
Recent research also provides insight into which creator sizes marketers prioritize.
- 54% of marketers surveyed by Aspire primarily worked with nano- or micro-influencers. (Aspire)
- Within Aspire’s survey, 27% primarily worked with nano-influencers, while another 27% primarily worked with micro-influencers. (Aspire)
- 32% of brands in Aspire’s research reported investing in mid-tier influencers. (Aspire)
27%
of marketers primarily worked with nano-influencers
27%
primarily worked with micro-influencers
54%
of marketers primarily worked with nano- or micro-influencers
These findings should not be interpreted as proof that one influencer tier produces the highest ROI across every campaign. Performance depends on the campaign objective, audience, creator, content format, and measurement method.
Influencer Content and Engagement Statistics
Video remains important in influencer collaboration research, but creators express different preferences depending on the length and format of content.
Sprout Social’s 2025 Influencer Marketing Report examined the content formats creators preferred when collaborating with brands.
53%
Short video: 15–30 sec
50%
Short video: 31–60 sec
48%
Static image posts
43%
Short video: under 15 sec
42%
Live video
27%
Long video: over 60 sec
Sprout Social — Influencer Marketing Statistics.
Additional content-related findings include:
- 49% of YouTube users preferred engaging with brands’ long-form videos in the same research. (Sprout Social)
- 77% of marketers in Aspire’s 2026 research repurposed influencer content in paid social advertising. (Aspire)
- 100% of surveyed enterprise marketers in Linqia’s research reported repurposing creator content beyond the creator’s original social channel. (Linqia)
Format preferences and engagement benchmarks are different measurements. A creator’s preference for producing video does not establish that every video format generates better engagement or conversions.
Instagram Influencer Marketing Statistics
Instagram remains an important channel for creator campaigns, particularly in categories where product imagery, lifestyle content, and short-form videos play an important role. Beyond influencer campaigns, broader Instagram marketing statistics provide additional context on how brands and audiences use the platform.
- 76% of Instagram influencers worldwide were reported to have fewer than 10,000 followers. (Sprout Social, citing Statista)
- Fashion-related influencer content generated 35.8 million posts in Sprout Social’s influencer benchmarking dataset, with a reported 1.59% average engagement rate. (Sprout Social)
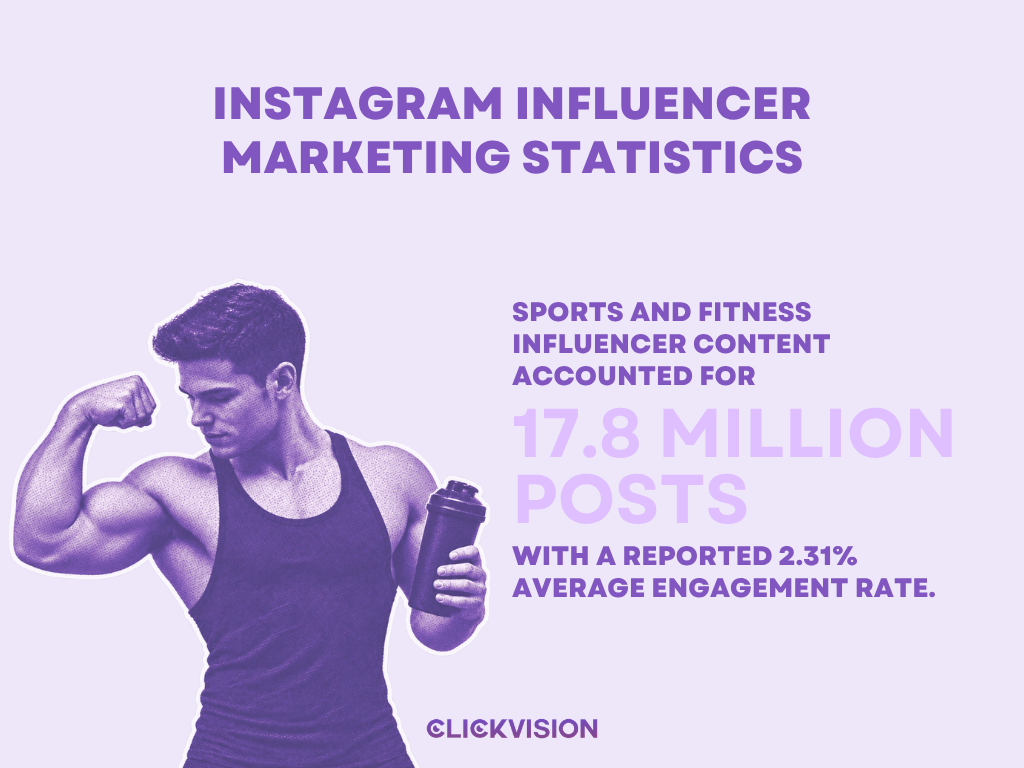
- Sports and fitness influencer content accounted for 17.8 million posts, with a reported 2.31% average engagement rate. (Sprout Social)
- Gaming influencer content recorded an average 3.15% engagement rate in the same Instagram benchmark dataset. (Sprout Social)
- Travel influencer content recorded an average 2.82% engagement rate. (Sprout Social)
These percentages describe particular categories within Sprout Social’s benchmarking data. They should not be presented as universal Instagram influencer engagement rates because the relevant content population and measurement method matter.
For mobile game publishers, engagement with gaming influencers is only one part of campaign evaluation. Installs, acquisition costs, and player retention provide a different view of commercial performance, making mobile game marketing statistics a useful comparison when assessing creator partnerships in this category.
TikTok Influencer Marketing Statistics
TikTok influencer marketing increasingly overlaps with social commerce, particularly as brands integrate creator content with shopping features. Broader TikTok marketing statistics provide additional context on the platform’s audience, engagement, and role in brand marketing.
- Beauty-related influencer content accounted for approximately 3.63 million TikTok posts in Sprout Social’s benchmarking dataset. (Sprout Social)
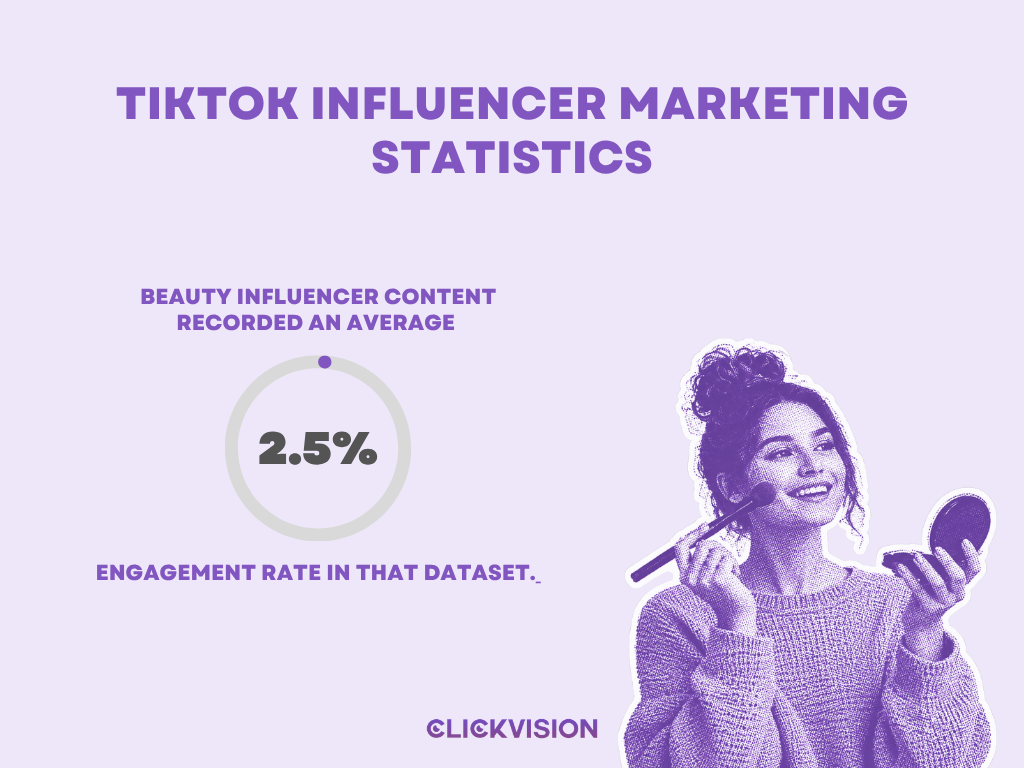
- Beauty influencer content recorded an average 2.46% engagement rate in that dataset. (Sprout Social)
- Travel-related content accounted for approximately 300,000 TikTok posts, with a reported 3.21% engagement rate. (Sprout Social)
- 32% of brands surveyed by Aspire were already selling through TikTok Shop, while 25% intended to start. (Aspire)
The combination of creator content and integrated shopping gives brands an additional way to track transactions. However, TikTok Shop adoption should not be interpreted as a direct measure of influencer campaign profitability.
YouTube Influencer Marketing Statistics
YouTube accommodates both short-form promotional content and longer videos that demonstrate products, answer questions, or explain purchasing considerations.
Sprout Social’s influencer benchmarking research identified several prominent content categories on the platform.
| YouTube influencer content category | Reported posts |
| Gaming | 1.24 million |
| Sports and fitness | 650,000 |
| Fashion | 549,000 |
| Travel | 146,000 |
Sprout Social — Influencer Marketing Statistics.
Additional findings include:
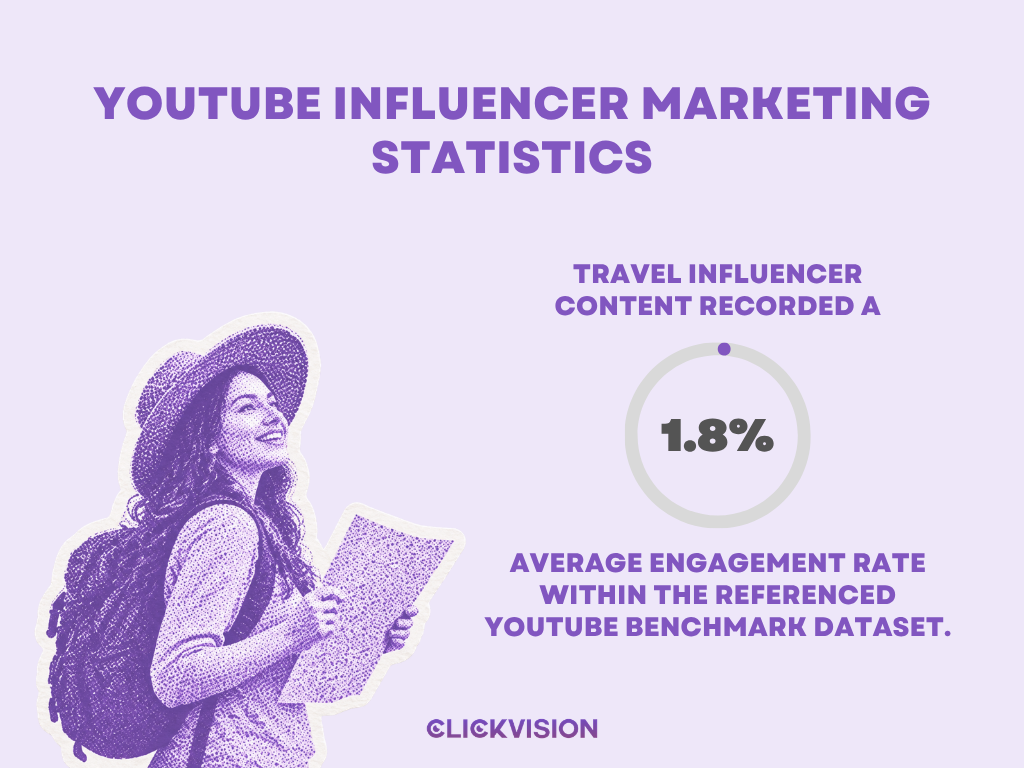
- Travel influencer content recorded a 1.83% average engagement rate within the referenced YouTube benchmark dataset. (Sprout Social)
- 52% of YouTube users surveyed in Sprout Social’s 2026 content strategy research were most likely to engage with brand videos shorter than 60 seconds. (Sprout Social)
- 49% of respondents favored long-form brand videos. (Sprout Social)
These figures should be understood within their original studies. In particular, post counts from one monitoring dataset do not represent the total volume of all influencer content published on YouTube.
Platform comparisons also need to account for how audiences discover content. YouTube videos can attract viewers through search long after publication, while feed-driven content often depends more heavily on recommendation-based distribution. Broader YouTube marketing statistics provide additional context on audience behavior and platform engagement beyond influencer campaigns.
Influencer Marketing Cost and Earnings Statistics
Creator compensation varies by social platform, audience size, production requirements, usage rights, and partnership terms. Research on influencer earnings provides useful reference points, but prices reported in one dataset should not be treated as fixed industry rates.
- 50% of influencers in Sprout Social’s 2025 research reported charging between $250 and $1,000 per post. (Sprout Social)
- IZEA’s historical marketplace data reported an average payment of $4,373 for Twitch posts. (IZEA)
- Instagram Story content averaged $2,784 per post in the same IZEA historical dataset. (IZEA)
- IZEA reported an average price of $12,007 for combined sponsorships involving a YouTube post and an Instagram Story. (IZEA)
- Nano-influencers with approximately 1,000–9,999 followers received an average of $1,105 per post in IZEA’s 2022 marketplace data. (IZEA)
- IZEA analyzed more than $70 million in negotiated creator payments across its marketplace from 2015 through 2022. (IZEA)
The IZEA figures describe historical transactions observed within its platform. They should not be used as current universal prices for influencers with comparable follower counts.
Long-Term Influencer Partnership Statistics
Recurring influencer relationships have become an important consideration for marketers interested in continuity, content development, and repeat collaboration.
- 71% of influencers in Sprout Social’s 2025 research offered discounts for longer-term partnerships. (Sprout Social)
- 25% of influencers said they would consider offering such discounts in the future. (Sprout Social)
- 63% of creators surveyed by Aspire preferred long-term partnerships over other campaign types. (Aspire)
- 99% of B2B teams using an always-on approach rated their influencer marketing programs as effective in the cited TopRank research. (Sprout Social, citing TopRank Marketing)
Long-term collaboration can offer pricing and planning advantages, but these survey findings do not prove that ongoing partnerships always outperform individual campaigns financially.
Influencer Marketing and Social Commerce Statistics
Social commerce gives brands ways to connect creator recommendations with shopping activity, product links, and affiliate attribution.
- Another 25% planned to begin selling through TikTok Shop, bringing the combined current-or-planned adoption figure to 57%. (Aspire)
- The proportion of surveyed brands already selling through TikTok Shop increased from 17% in the previous year to 32% in Aspire’s latest research. (Aspire)
- Creators using Aspire generated more than $52 million in attributed affiliate sales in 2025. (Aspire)
- Those Aspire-attributed affiliate sales increased 45% year over year. (Aspire)
- Aspire reported an average influencer marketing CPM of $2.68 in 2025, representing a 42% year-over-year decrease across its measured platform activity. (Aspire)
Aspire’s affiliate and CPM figures describe activity measured through its platform. They are not estimates of global influencer-generated sales or global influencer advertising costs.
Attributed sales also need to be evaluated against creator commissions, product margins, and customer returns before assessing profitability. This connects influencer marketing performance with the wider commercial considerations reflected in ecommerce statistics, where sales activity and business outcomes are not necessarily interchangeable.
AI Influencer Marketing Statistics
Artificial intelligence is becoming part of influencer discovery, content planning, reporting, and campaign management. Research also shows a distinction between marketers using AI as a supporting tool and consumer acceptance of fully synthetic influencers.
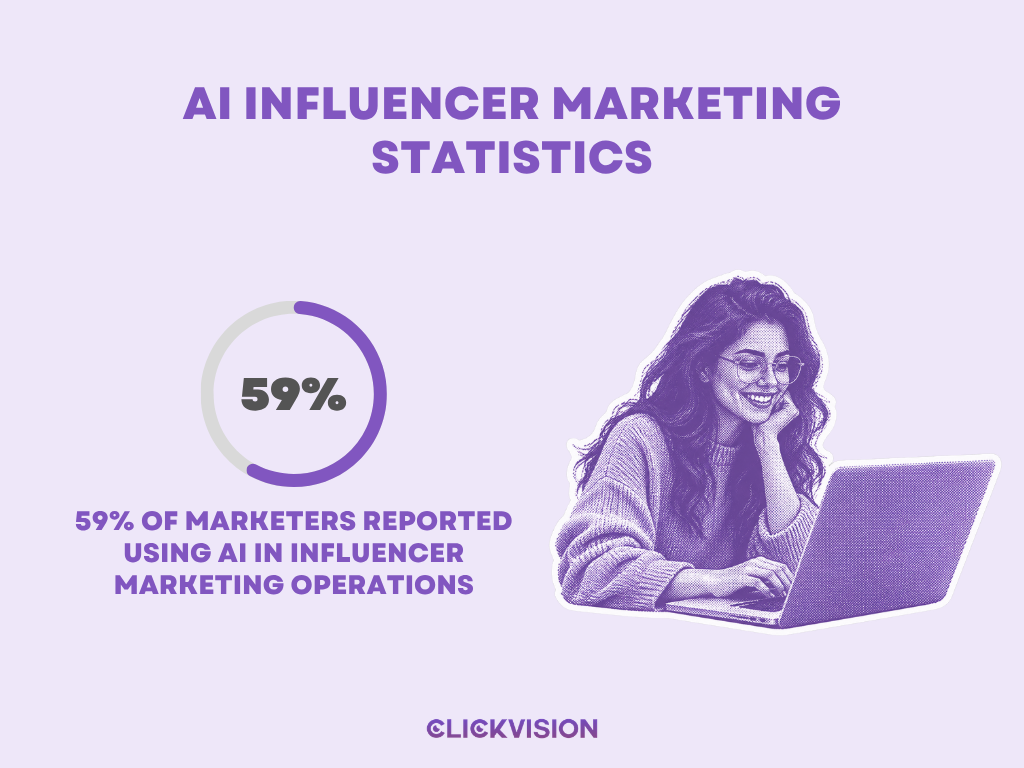
- 59% of marketers surveyed by Aspire reported using AI in influencer marketing operations. (Aspire)
- 74% of enterprise marketers surveyed by Linqia used AI for activities such as generating ideas, writing briefs, and streamlining workflows. (Linqia)
- 89% of Linqia’s enterprise respondents still avoided working with virtual influencers. (Linqia)
- 44% of consumers in Sprout Social’s 2026 research expressed discomfort with brands using AI influencers. (Sprout Social)
- 49% of influencers in research reported by Shopify used AI tools for content creation. (Shopify, citing Aspire)
These findings point to different attitudes toward AI-assisted workflows and AI-generated personalities. Using AI to organize creator research is not equivalent to replacing a human influencer with a synthetic character.
B2B Influencer Marketing Statistics
B2B influencer marketing often involves industry experts, practitioners, and subject-matter specialists. Recent research shows that businesses use these partnerships for objectives extending beyond product promotion.
- 58% of B2B marketing teams in TopRank Marketing’s research used an always-on influencer marketing approach. (Sprout Social, citing TopRank Marketing)
- 67% of B2B brands surveyed in Sprout Social’s Q1 2025 Pulse Survey used influencer marketing to increase brand awareness. (Sprout Social)
- 54% used influencer marketing to strengthen credibility and trust. (Sprout Social)
- 37% identified audience engagement and customer loyalty as important objectives. (Sprout Social)
- 29% used influencer partnerships to support product development or co-creation. (Sprout Social)
- 24% identified revenue growth as an influencer marketing objective. (Sprout Social)
- 49% of B2B marketers in research reported by Sprout Social expected influencer content integration to be an important marketing trend in 2025. (Sprout Social)
These figures demonstrate the range of objectives associated with B2B influencer marketing. They do not establish how much revenue B2B influencer partnerships generate or how their financial returns compare with other channels.
Influencer Fraud and Authenticity Statistics
Influencer fraud research commonly examines artificial followers, manipulated engagement, and inaccurate audience representations. These issues matter because follower and engagement counts can influence creator selection and campaign spending.
One estimate reported by Shopify, citing SociaVault, analyzed more than 100,000 influencer accounts and found signs of inauthentic followers in over 37% of them. However, the underlying sampling and classification methods were not sufficiently established in the reviewed research to treat that figure as a representative industry-wide fraud rate. (Shopify)
For that reason, the final database does not establish a defensible universal percentage of fraudulent influencer accounts, the industry’s total annual losses, or the accuracy of AI-powered fraud detection.
These remain important research gaps rather than opportunities to substitute unsupported estimates.
Influencer Marketing Measurement and Attribution Statistics
As influencer marketing programs expand, campaign reporting becomes increasingly important. Recent research suggests that marketers measure a mixture of engagement, traffic, and conversion outcomes.
- 48% identified attribution as their largest measurement gap. (Linqia)
- 68% of marketers in Sprout Social’s research measured influencer marketing performance through social engagement. (Sprout Social)
- 50% monitored traffic generated by influencer links. (Sprout Social)
- 67% of brands in Aspire’s research included content usage rights in their initial creator contracts or pricing arrangements. (Aspire)
Measurement choices should follow the objective of the campaign. Awareness initiatives, product launches, affiliate programs, and direct-response advertisements require different indicators of performance.
Conclusion
Influencer marketing statistics for 2026 show continued investment in creator partnerships, wider use of influencer-generated content, and growing integration with paid advertising and social commerce. Research from Aspire, CreatorIQ, Linqia, and Sprout Social also highlights the importance of creative collaboration, audience relevance, and measurable campaign outcomes.
However, industry growth does not eliminate the challenges of attribution, inconsistent benchmarks, and unsupported performance claims. The most useful statistics are those that identify their source, population, reporting period, and measurement method. These distinctions help marketers make informed decisions without mistaking individual survey findings for universal industry results.