
Mobile game marketing statistics tell a story that surprises even seasoned marketers. Budgets are growing, competition is intensifying, and the rules around user acquisition keep shifting.
Studios that relied on the same playbook two years ago are now facing rising install costs, tighter tracking restrictions, and a user base that’s harder to hold onto than ever. The market isn’t slowing down — it’s just getting more demanding.
Below, we’ll break down the numbers that actually matter: from where players discover games to what ad formats drive real results. You’ll learn what the data says about CPI trends, retention benchmarks, creative fatigue, and where the smartest marketing spend is going in 2026.
Game Discovery
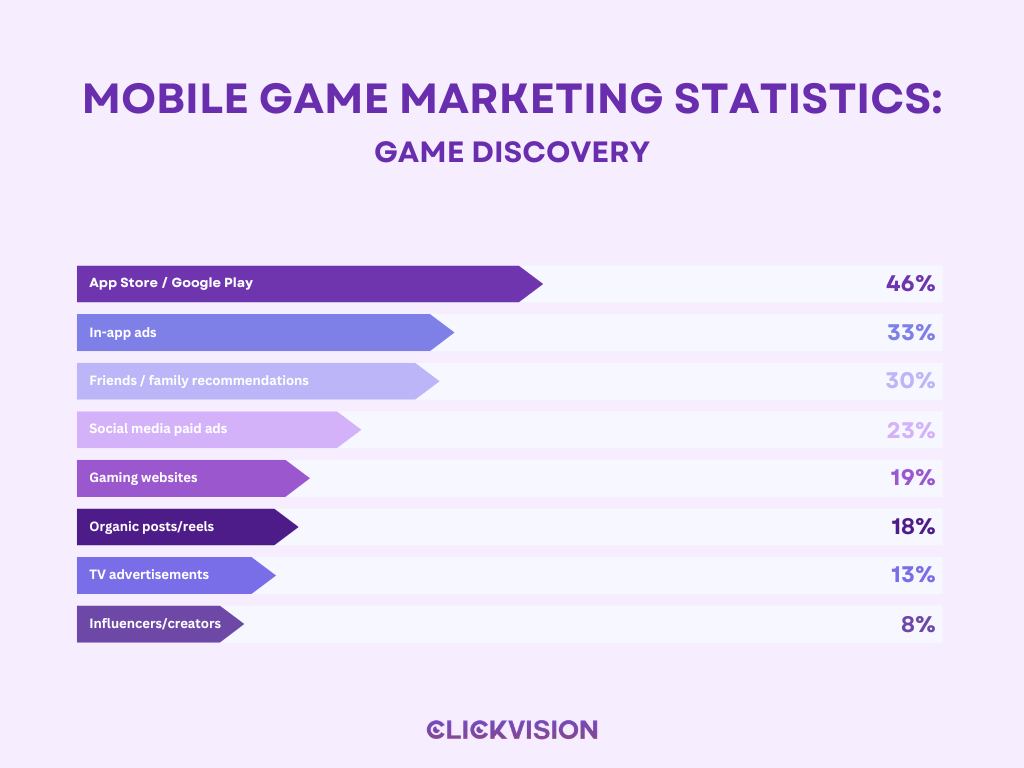
How players find new games reveals a lot about where marketing budgets should go. The app stores themselves remain the dominant discovery channel by a significant margin, underscoring the importance of app store optimization.
One of the most surprising mobile game marketing statistics is how low influencer-driven discovery sits at just 8%. This is particularly striking given the enormous attention paid to creator marketing in industry discussions.
| Discovery Channel | Share of Users |
| App Store / Google Play | 46% |
| In-app ads | 33% |
| Friends / family recommendations | 30% |
| Social media paid ads | 23% |
| Gaming websites | 19% |
| Organic social media posts/reels | 18% |
| TV advertisements | 13% |
| Influencers and creators | 8% |
Source: SQ Magazine
Market Size & Advertisers
The fact that nearly a quarter of all advertisers in the year were new entrants suggests the market is still attracting fresh competition rather than consolidating around incumbents.
- The average monthly number of mobile game advertisers exceeded 84,000 in 2025 — a 21.9% year-over-year increase — peaking at over 90,000 in June. (Business of Apps)
- New advertisers made up 23.4% of all advertisers throughout the year. (Business of Apps)
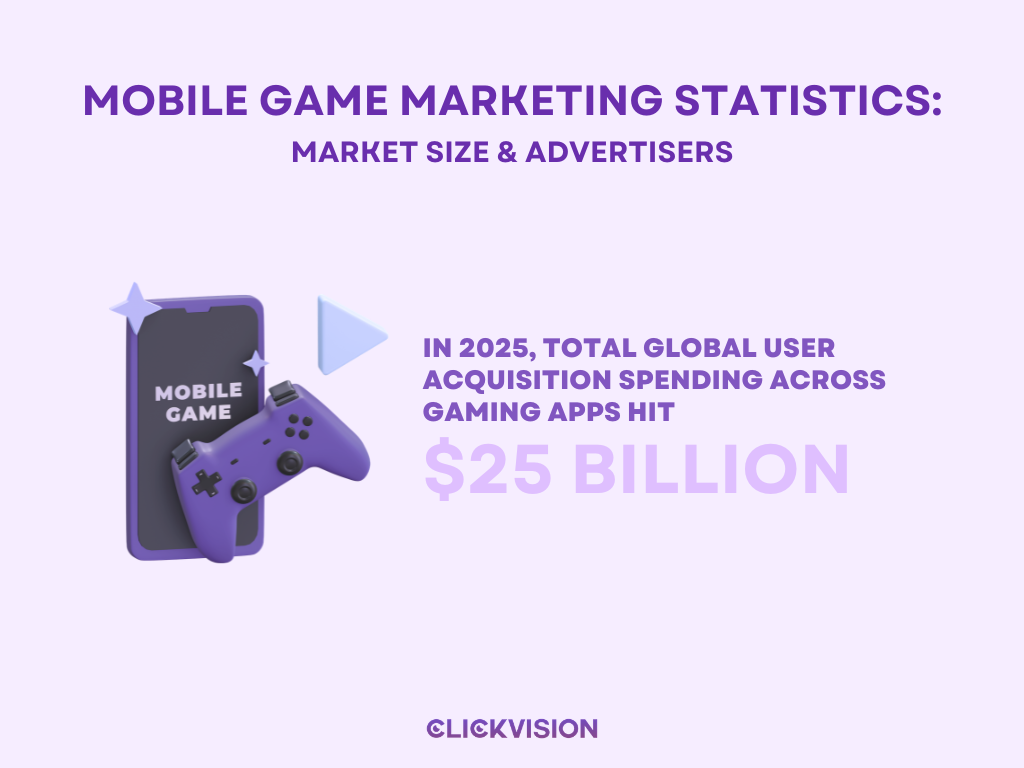
- Total global user acquisition spending across gaming apps hit $25 billion in 2025. Nearly half of that spend was directed at the US market, while emerging regions like Turkey and India saw the sharpest growth, up 29% and 19% respectively. (AppsFlyer)
UA & Ad Spend
User acquisition costs are heading in a difficult direction for marketers. Costs grew at three times the rate of the actual user base in 2025, which is the kind of squeeze that forces studios to be much more deliberate about where and how they spend.
- Global gaming ad spend grew at a low single-digit rate year-over-year in 2025. (Business of Apps)
- Acquisition costs rose 12% year-over-year while the user base grew by just 2%. (Business of Apps)
Advertising
Mobile game advertising is a $62 billion market, and the format mix matters enormously. Video has become the default, while rewarded ads have carved out a particularly strong position in casual titles.
The data around ad frequency is worth paying attention to. Possibly the most useful of all mobile game marketing statistics here: fewer ads per session actively improves retention — a direct argument for quality over quantity in monetization strategy.
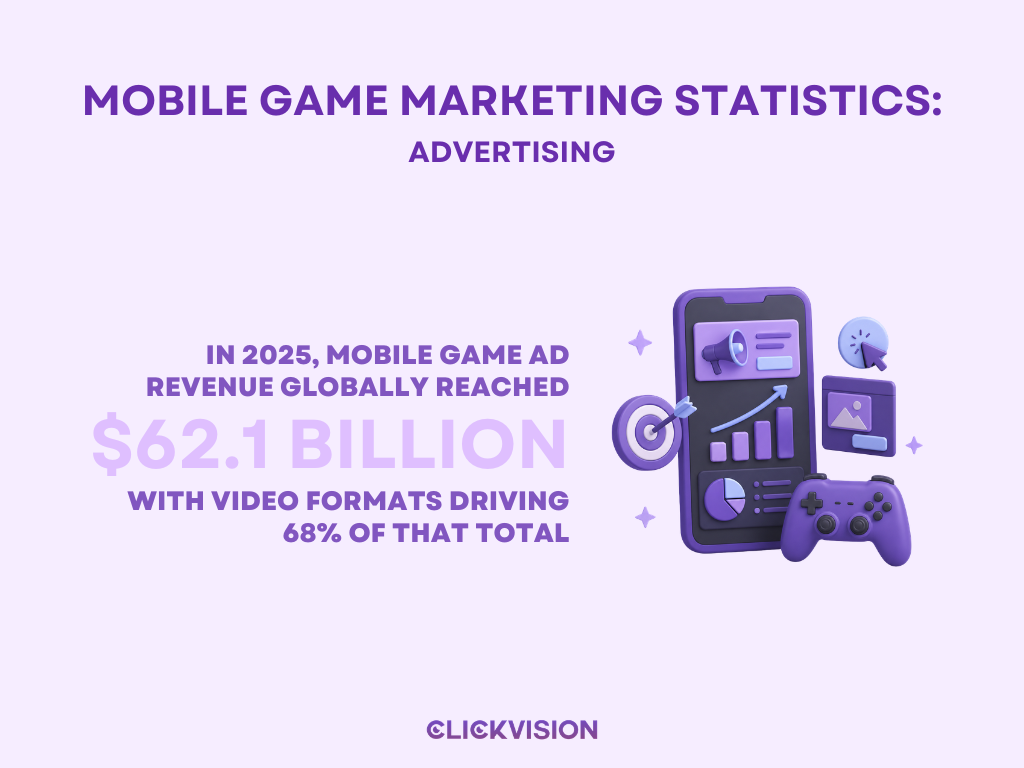
- Mobile game ad revenue reached $62.1 billion globally in 2025, with video formats driving 68% of that total. (SQ Magazine)
- Rewarded ads contribute 45% of ad revenue across casual titles. (SQ Magazine)
- Playable ads deliver 3x higher engagement than static formats, with a Click-Through Rate (CTR) of up to 15.4%. (SQ Magazine)
- The US leads with $19.4 billion in mobile gaming ad revenue in 2025. (SQ Magazine)
- Games that show fewer than 3 interstitial ads per session retain 27% more users. (SQ Magazine)
- AI-driven ad personalization increased Effective Cost Per Thousand Impressions (eCPM) by 12% across Android platforms. (SQ Magazine)
- Offerwalls increased Average Revenue Per User (ARPU) by 17%, particularly in Tier 2 and Tier 3 markets. (SQ Magazine)
- Programmatic ad networks are used in 73% of the top 200 games. (SQ Magazine)
- In-game brand collaborations — such as fashion and film tie-ins — are valued at $1.6 billion globally. (SQ Magazine)
- Short-form video ads under 10 seconds pushed ad completion rates to 91%. (SQ Magazine)
- Around 50% of studios now use AI in game development; approximately 20% of new Steam games disclosed AI use by mid-2025. (SQ Magazine)
Advertising Platforms
Meta and Google remain the two dominant platforms for mobile game advertisers. Meta’s scale on Facebook and its broader family of apps gives it particularly strong reach for casual and mid-core games. While Google platforms benefit from the intent-driven nature of search and Play Store discovery.
- Meta platforms housed 135,000 game advertisers, with an average of 16,500 monthly advertisers on Facebook. (Business of Apps)
- Casual puzzle games were the most advertised category on Google platforms, with 4,000 advertisers. (Business of Apps)
Ad Spend by Genre
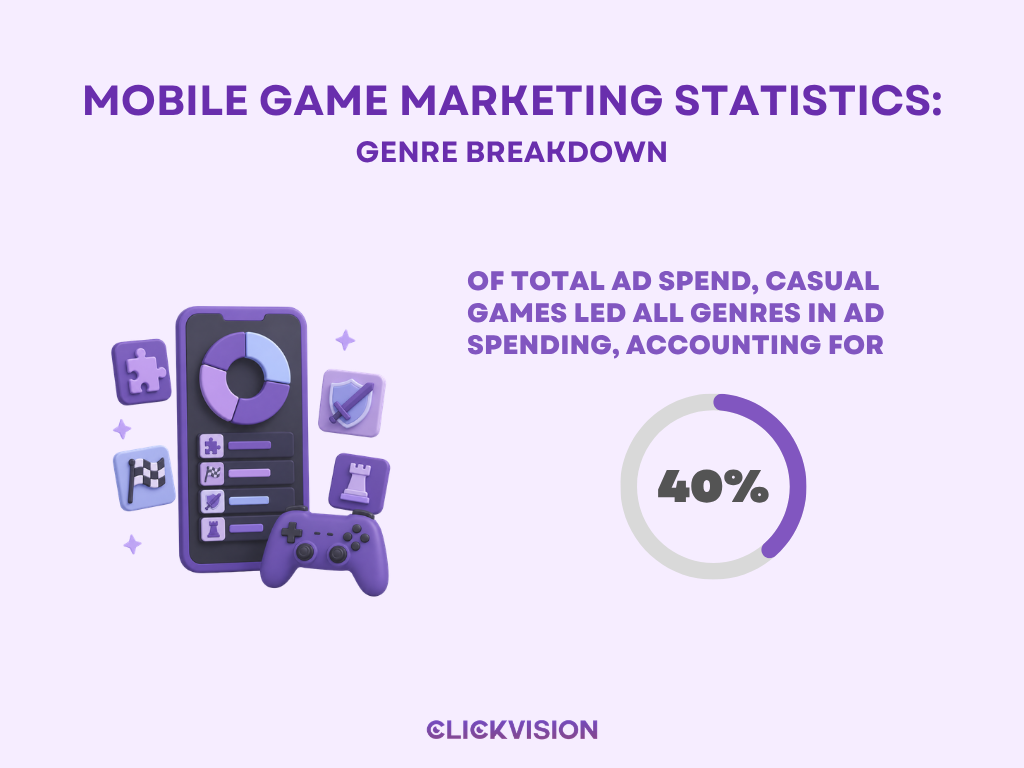
Casual games lead all genres in advertising spend, reflecting the high volume of titles competing for installs in that category.
- Casual games led all genres in ad spending, accounting for 35–40% of total ad spend. (Business of Apps)
- Match games made up nearly 20% of total gaming ad spend in 2023. (Business of Apps)
Genre Breakdown
- RPG maintained the highest creative investment of any genre, averaging over 800 new ad creatives per year. (Business of Apps)
- Casino was the fastest-growing advertising vertical, with the number of advertisers up 22.7% year-over-year (representing 47% of the segment) and creatives up 13.9% year-over-year (22.3% of the segment). (Business of Apps)
CPI Rates
Cost-per-install (CPI) is the primary benchmark for measuring mobile user acquisition efficiency. The numbers vary dramatically across genres, platforms, and regions, and understanding those gaps is critical for building a realistic UA budget.
The iOS/Android split is one of the most important dynamics to grasp here. iOS installs consistently cost more because iPhone users have higher average spending, which makes them more valuable to advertisers.
- Average global Cost Per Install (CPI): $2.50–$3.50 on iOS and $1.50–$2.50 on Android. (Business of Apps)
- Average global CPI for casual gaming apps: $0.98. (Business of Apps)
- Following Apple’s App Tracking Transparency (ATT) framework in 2020–2021, CPI for casual games jumped to $1.96, before falling to $1.10 and settling at $0.98 by 2022–2023. (Business of Apps)
- CPI by casual game category: Lifestyle – $1.32, Simulation – $0.59, Puzzle – $0.90. (Business of Apps)
- CPI by platform: iOS – $2.23, Android – $0.63. (Business of Apps)
| Genre | CPI (iOS) | CPI (Android) |
| Casino | $11.45 | $1.14 |
| RPG | $7.70 | $3.04 |
| Match | $5.74 | $1.45 |
| Simulation | $3.07 | $0.66 |
| Puzzle | $2.32 | $0.69 |
Source: Business of Apps
Regional CPI differences are just as significant. North America is nearly seven times more expensive than Latin America on a per-install basis. This is why many studios test and optimize their creatives in lower-CPI markets before scaling in North America.
- CPI for Playable Ads ranged from $1.63 to $2.94 on Android. Native ads carried the highest CPI at $5.00–$5.15. (Business of Apps)
- Apple Search Ads conversion rate for mobile games: 68%. (Business of Apps)
| Region | Average CPI |
| North America | $3.59 |
| EMEA | $0.90 |
| Latin America | $0.55 |
Source: Business of Apps
CPM Rates
Cost-per-thousand-impressions (CPM) reflects how much advertisers pay to get their ad seen.
- Average Cost Per Thousand Impressions (CPM) rates reached as high as $19.31, with the USA recording the highest rates, followed by Australia and Japan. (Business of Apps)
| Genre | Average CPM |
| Strategy | $21.58 |
| Simulation | $19.22 |
| Puzzle | $18.47 |
| Board | $7.70 |
Source: Business of Apps
In-App Advertising
In-app advertising is a substantial revenue stream in its own right, with gaming apps generating nearly half of all in-app ad impressions across the entire app ecosystem.
The willingness of users to accept ads in exchange for content or rewards is notably high, and it points toward a user base that is more receptive to advertising than the general internet audience.
- Gaming apps account for 46% of all in-app ad impressions. (SQ Magazine)
- The average conversion rate for rewarded video ads within apps is 7.2%. (SQ Magazine)
- 61% of users say they don’t mind in-app ads if they enhance or unlock content. (SQ Magazine)
- 36% of mobile marketers are investing in interactive in-app ad formats such as playable ads. (SQ Magazine)
Ad Blocking
Ad blocking is a real and growing challenge, but the data suggests it’s more nuanced than a flat rejection of advertising. Most ad blocker users are still reachable if the format respects their attention and the content is relevant.
These figures below show that the problem is really about ad quality, not advertising itself.
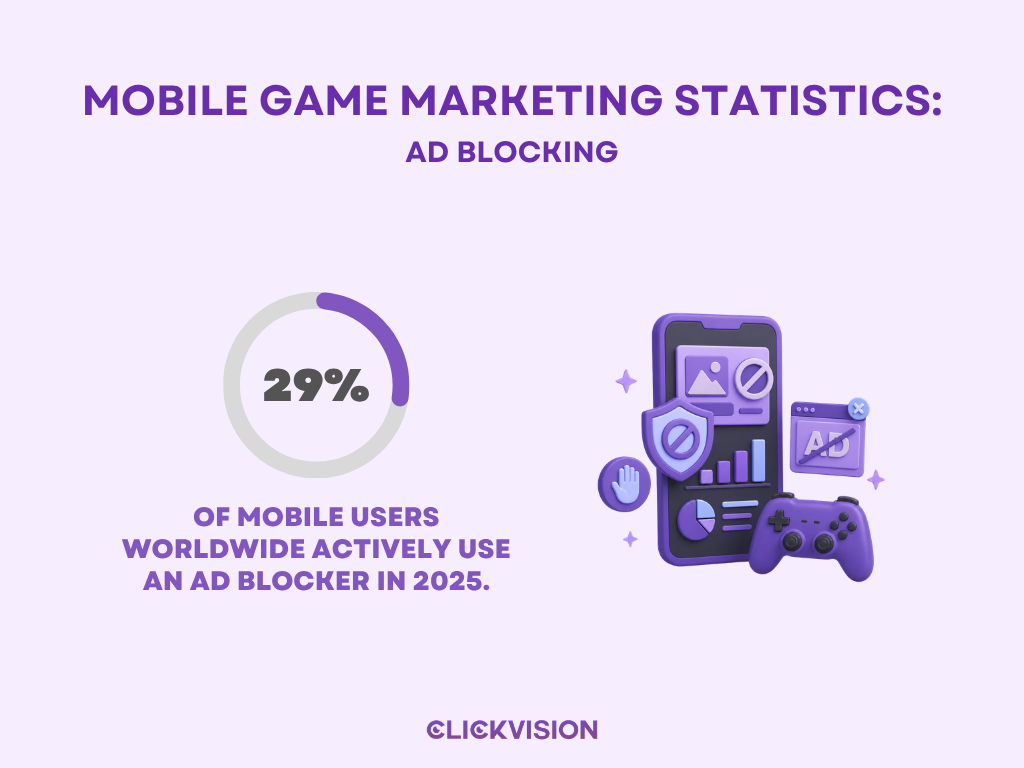
- 29% of mobile users worldwide actively use an ad blocker in 2025. (SQ Magazine)
- 34% of Gen Z mobile users in the US report blocking ads on a regular basis. (SQ Magazine)
- Mobile ad blocking is estimated to cost the industry $7.2 billion in annual ad revenue losses. (SQ Magazine)
- 21% of ad blocker users say they would consider turning off their blocker for non-intrusive ad experiences. (SQ Magazine)
- 68% of ad blocker users still engage with branded content when it is well integrated into the experience. (SQ Magazine)
Creatives
Creative refresh cadence (CTR) has become one of the most operationally important elements of mobile game marketing. The data tells a clear story: ad creative gets stale fast, and the studios that are most aggressive about rotating new material are better protected against performance decay.
The mobile game advertising statistics around creative fatigue are particularly telling. CTR can drop by 45% after just four exposures to the same creative is a strong argument for building creative production pipelines rather than treating creative development as a one-time investment. Short-form video under 30 seconds is now the dominant format, making up more than half of all creatives produced.
- 82.5% of advertisers launched new creatives every month on average, up 14.6% year-over-year. (Business of Apps)
- The share of newly released creatives peaked at 63.2% in December. (Business of Apps)
- Video creatives led all formats at 74.1%, with short-form videos under 30 seconds making up 58% of all creatives. (Business of Apps)
- Click-Through Rate (CTR) can drop by up to 45% after four exposures without a creative refresh. (Business of Apps)
- Structured creative refresh cycles improve performance stability by 30%. (Business of Apps)
How Mobile Games Monetize Users
Acquiring users is only half the battle. Once players are in, studios need to convert them into paying customers — and keep them spending. The data shows that the right monetization systems make a measurable difference, from how games introduce in-game currency to how often players see ads.
- Live events and limited-time offers drive up to 30% more in-app purchases during peak promotional periods. (SQ Magazine)
- Rewarded video ads increase daily active user spending by 18% through IAP conversions. (SQ Magazine)
- Onboarding tutorials that introduce in-game currency increase the conversion rate to paying users by 21%. (SQ Magazine)
- Hybrid monetization models combining in-app purchases and ads in hyper-casual games grew total revenue by 14% year-over-year. (SQ Magazine)
- In-game advertising revenues reached $9.5 billion in 2023. (Business of Apps)
- Over 70% of mobile gamers are willing to watch ads during gameplay. (Business of Apps)
App Installs & Growth
Install growth has been far from a straight line across platforms. The table below reveals how sharply Android and iOS have diverged year to year, often moving in opposite directions.
| Year | Android Install Growth | iOS Install Growth |
| 2020 | +60% | +20% |
| 2021 | -10% | +2% |
| 2022 | +19% | -1% |
| 2022–2023 | +7.9% | -5% |
| 2023 | +12–15% | +8–10% |
Source: Business of Apps
Retention & Engagement
Retention is the most important metric in mobile gaming because acquiring a user means nothing if they leave within the first month.
Day 1 and Day 7 retention rates tell you whether a game’s core loop is working. A Day 1 rate of 32.5% is the current average, which means roughly two thirds of players never return after their first session. Climbing above that benchmark is the primary goal of onboarding design.
- More than 95% of mobile game users stop playing within 30 days of installing. (Business of Apps)
- The average Day 1 retention rate for mobile games is 32.5%. (SQ Magazine)
- Day 7 retention improved to 13.8%, driven by better onboarding and push notifications. (SQ Magazine)
- Competitive Day 1 retention benchmarks sit at 30–35% overall and 35–40% on iOS; Day 7 retention should exceed 15–18%. Games falling below 25% Day 1 retention face structural disadvantages in paid User Acquisition (UA) auctions. (Business of Apps)
- Games with personalised onboarding see 45% higher retention than those with a generic welcome experience. (SQ Magazine)
- The average mobile game session lasts 17 minutes. (SQ Magazine)
- Running User Acquisition (UA) and retargeting as a single unified system can deliver up to 20% higher Lifetime Value (LTV). (Business of Apps)
- North America recorded 483.1 million in overall mobile game acquisition volume; EMEA posted 50% year-over-year growth. (SQ Magazine)
- App Store Day 1 retention sits at approximately 28–35%; Google Play Day 1 retention sits at approximately 25–32%. (Asomobile)
Regional & Platform
Europe stands out as the most active advertising market by sheer advertiser count. The Hong Kong/Macau/Taiwan cluster leading on creative intensity reflects a highly competitive regional market where advertisers refresh creatives at an unusually high rate to stay ahead.
- Europe was the most active advertising market, averaging 46,000 advertisers per month. (Business of Apps)
- Hong Kong, Macau, and Taiwan had the highest creative output at 122 creatives per advertiser per month. (Business of Apps)
- Android advertisers made up nearly 80% of the total; for mid-core and hard-core titles, over 32% of creatives ran on iOS. (Business of Apps)
- Android Cost Per Installs (CPIs) are typically 40–60% lower than on iOS. (Business of Apps)
Key Market Trends
The 50 conversions per week requirement for Meta and Google’s algorithms to exit their learning phase is a practical constraint that affects budget-setting, particularly for smaller studios.
The shift toward external web stores is another development worth watching closely. Here’s a condensed version: Apple takes 30% of in-app purchases versus roughly 5% on external web stores. Which is why over 72% of top-grossing games now route transactions outside the App Store.
- A single ad creative loses effectiveness after roughly four exposures to the same user. (Asomobile)
- Meta and Google’s ad algorithms require approximately 50 conversions per week to exit the learning phase. (Asomobile)
- More than 72% of top-grossing games now operate external web stores. (Asomobile)
Recent Developments
These developments are shaping the near-term trajectory of mobile game marketing. Apple’s tightened tracking restrictions are reinforcing the industry’s broader shift toward privacy-first measurement approaches. Meta’s Advantage+ improvements represent one of the clearer cases of AI-driven performance gains in paid acquisition.
- Apple’s iOS 18 has introduced tighter tracking restrictions, affecting over 40% of mobile ad campaigns. (SQ Magazine)
- Meta’s Advantage+ Shopping Campaigns are delivering 18% higher Return on Ad Spend (ROAS) on mobile-first conversions. (SQ Magazine)
Conclusion
The mobile game marketing statistics covered in this article paint a clear picture. Costs are rising, competition isn’t easing, and player attention is harder to hold than ever. But the data also points toward what actually works — smarter creative strategies, better onboarding, more deliberate ad placement, and monetization systems that respect the player experience.
The studios winning in this market aren’t just spending more, they’re spending smarter. By understanding where the numbers are heading, marketers can make sharper decisions and build campaigns that hold up beyond the first install.