
Millennials grew up alongside the internet, watched social media take off, and changed how brands connect with customers. Now, their priorities are shifting as careers, families, and financial responsibilities shape their purchasing decisions. For marketers, keeping up with these changes isn’t always straightforward. The latest Millennial marketing statistics offer a closer look at what influences this generation and where brands can reach them.
In this article, we’ll explore Millennials’ spending power, shopping habits, social media preferences, and responses to advertising. We’ll also examine brand loyalty, technology adoption, and how their behavior compares with other generations. Each statistic includes a source, helping you explore the data and understand the trends behind it.
Key Takeaways
Online shopping is a major part of their spending habits. About 85% of Millennials shop online, while 82% also shop in physical stores.
Social media plays an important role in product discovery. Around 43% of Millennials discovered a new product through social media within the past three months.
Influencer recommendations affect purchasing decisions. Approximately 36% of Millennials have purchased a product based on an influencer recommendation.
Digital payments are widely adopted. About 82% of Millennials prefer contactless payments, while 44.1% use mobile wallets at checkout.
AI is becoming part of the shopping experience. In 2025, 41% of Millennials used generative AI while shopping, compared with 45% of Gen Z.
Millennial Purchasing Power and Spending Statistics
Millennials hold significant spending power, both in the US and worldwide. The statistics below cover how much they spend at retail and how much buying power the generation is expected to gain in the coming years.
US Retail Spending
Millennials account for a large share of US retail dollars, well beyond what their share of the population would suggest. The figures below come from two different data years, 2026 and 2024, so keep that in mind when comparing them.
- Millennial retail spending totals $1.127 trillion annually, 28.3% of all US retail spending (Capital One Shopping, via EMARKETER, 2026).
- The average Millennial spends $31,256 per year on retail, 6.16% more than the average consumer (Capital One Shopping, via EMARKETER, 2026).
- Millennials generated about $1.18 trillion in US retail spending in 2024, 29.4% of the national total (Capital One Shopping, via Review42).
- The average Millennial spent about $32,089 on retail in 2024 (Capital One Shopping, via Review42).
- Millennials drive 29.4% of US retail spending while making up about 22% of the population, roughly 1.3x their population share (Review42 analysis).
Global Buying Power
Millennial influence extends well beyond the US market. The figures below are projections, so treat them as estimates of where global buying power is headed rather than reported results.
- Millennial global buying power is estimated at about $2.5 trillion in 2025 and projected to exceed $10 trillion by 2030 (Fortunly). This is a forecast.
- That projection implies a compound annual growth rate of about 32% between 2025 and 2030 (Review42 analysis).
Millennial Financial Behavior and Payment Statistics
Millennials combine financial caution with early adoption of new payment tools. Many feel pressure on their finances, yet they are also among the quickest to embrace digital and flexible ways to pay.
Digital Payments
Digital payment preferences are one way Millennial financial behavior differs from that of other generations. Peer-to-peer transfers, contactless payments, and mobile wallets all influence how this audience interacts with financial technology. These patterns are also relevant when considering broader financial services marketing statistics and the changing expectations of financial consumers.
- Over 80% of US Millennials will make peer-to-peer payments in 2026, making them the highest-adopting generation for mobile payments (EMARKETER forecast).
- 82% of Millennials prefer contactless digital payments (Capital One Shopping, via EMARKETER).
- 44.1% of Millennials use mobile wallets at point of sale, 78.9% more likely than Gen Z (Capital One Shopping, via EMARKETER). The second figure is a relative difference.
- Millennials are 144% more likely than the average shopper to use Buy Now, Pay Later (Capital One Shopping, via EMARKETER). This is a relative difference.
Millennial Shopping Habits Statistics
Millennials move easily between screens and store aisles, and they do plenty of research before they buy. The statistics below cover where they shop, how they research products, and how they spend on impulse and subscriptions.
Online vs In-Store Shopping
Millennials shop across both digital and physical channels, making it important to distinguish how many people shop online from how much of their spending happens there. Broader ecommerce statistics provide context for these shopping patterns and show how online retail fits into the overall consumer market.
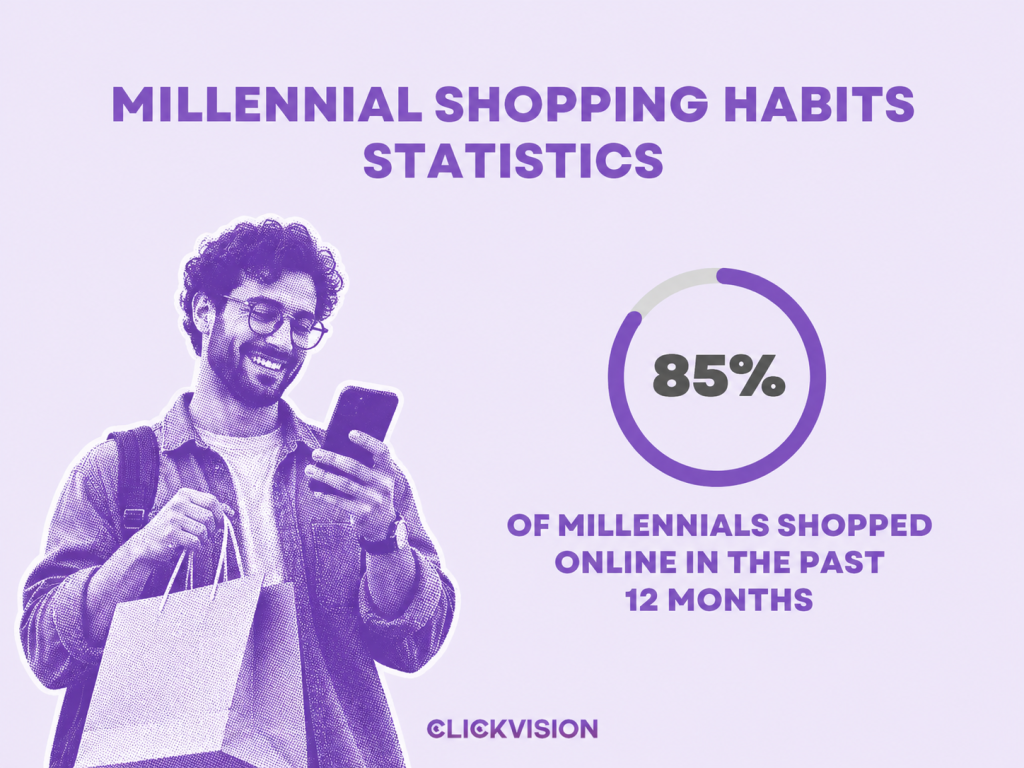
- 85% of Millennials shopped online in the past 12 months (Capital One Shopping, via Review42).
- 82% of Millennials shopped in-store in the past 12 months (Capital One Shopping, via Review42).
- About 58% of Millennial shopping happens online (Capital One Shopping, via Review42).
Mobile and Brand Channels
Smartphones and brand-owned channels are central to how Millennials browse and research. The first figure below is labeled directional, and the SAP figures reflect consumer products shoppers specifically, so they may not represent all Millennial shoppers.
- An estimated 82% to 85% of Millennials prefer their smartphone for online shopping (industry surveys, via Review42).
- 33% of Millennials browse directly from a brand’s app when shopping (SAP Global Consumer Products Engagement Report, via SAP Engagement Cloud blog).
- 45% of Millennials prefer researching products on brand websites (SAP Global Consumer Products Engagement Report, via SAP Engagement Cloud blog).
Product Research and Reviews
Before buying, Millennials look for proof that a product delivers, and customer feedback is one of the strongest signals they use. The statistic below shows how much weight verified reviews carry.
- 90% of Millennials say they are more likely to purchase from a brand after reading verified customer reviews (Content Science).
Impulse Buying and Subscriptions
Millennial spending is shaped by spur-of-the-moment purchases and a preference for flexible access over ownership. These habits show up in both everyday shopping and streaming subscriptions.
- Millennials are the generation most likely to be impulse shoppers and to pay for access rather than ownership (Content Science).
- On average, 46% of Millennials added and canceled at least one streaming subscription, versus an average of 33% (Content Science).
Millennial Social Media Marketing Statistics
Social media is where Millennials spend much of their time, and it increasingly shapes what they buy. The statistics below cover platform usage, product discovery, social commerce, and how they interact with brands.
Platform Usage and Time Spent
Pew Research Center reports platform usage by age group rather than by generation, so the platform figures below cover US adults aged 30 to 49, the closest match to Millennials. The remaining figures look at how much time Millennials spend on social platforms and how many accounts they hold.
- Millennials spend an average of 2.25 hours per day on online social platforms (Content Science).
- Millennials worldwide own an average of 8.4 social media accounts (Content Science).
- 72% of Millennials report their social media usage has risen in the past year (Content Science).
- More than 90% of Millennials watch short-form videos on platforms such as YouTube, TikTok and Facebook (Content Science).
Most Used Platforms Among US Adults Aged 30 to 49
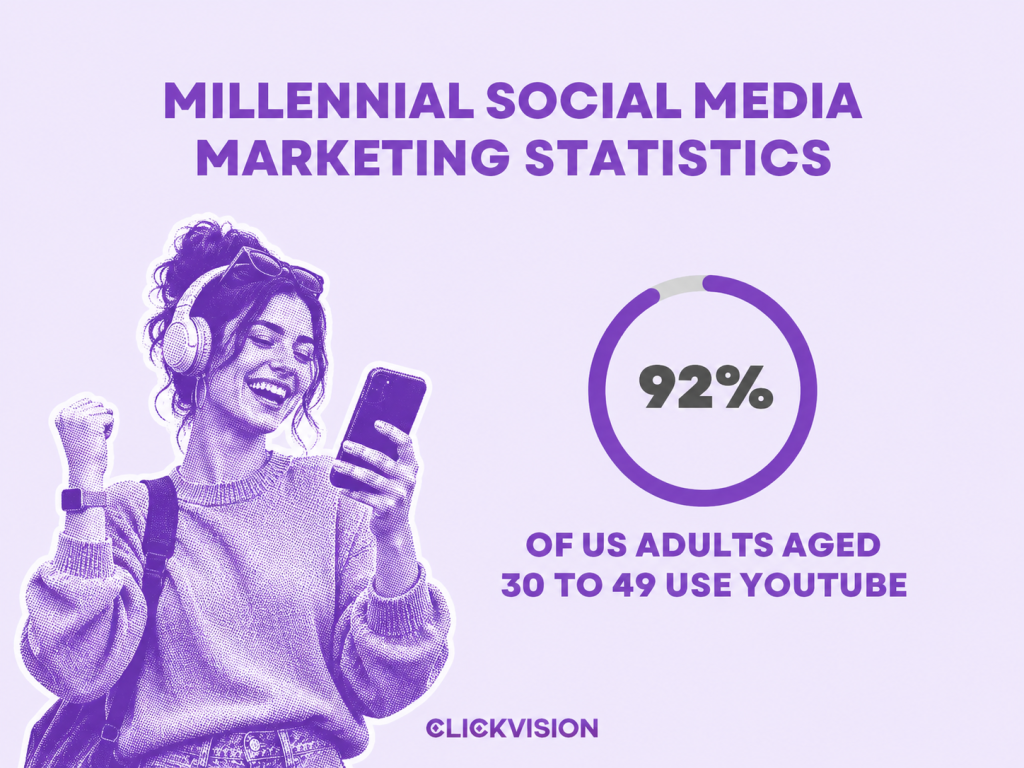
- 92% of US adults aged 30 to 49 use YouTube
- 80% of US adults aged 30 to 49 use Facebook
- 62% of US adults aged 30 to 49 use Instagram
- 44% of US adults aged 30 to 49 use TikTok
Less Used Platforms Among US Adults Aged 30 to 49
- 40% of US adults aged 30 to 49 use WhatsApp
- 35% of US adults aged 30 to 49 use Reddit
- 31% of US adults aged 30 to 49 use Snapchat
- 25% of US adults aged 30 to 49 use X
Source: Pew Research Center, 2025, via Review42
Product Discovery on Social Media
Social media serves as more than a communication channel for Millennials. It also influences how they encounter brands and discover products before making purchasing decisions. Looking at broader social media marketing statistics helps put these discovery habits into context across different audiences and platforms.
- About 43% of Millennials discovered a new product on social media in the past three months (EMARKETER).
- 34% of Millennials say social media is where they discover new products most often (EMARKETER).
Social Commerce
For many Millennials, social platforms are now a place to buy as well as browse. The figures below come from different sources, and the SAP figure reflects consumer products shoppers only.
- 43% of Millennials have bought through an in-app shop in the past three months (EMARKETER).
- Millennials are the most active buyers on TikTok Shop (Edison Research, via EMARKETER).
- 22% of Millennials use social commerce platforms such as Instagram Shop (SAP Global Consumer Products Engagement Report, via SAP Engagement Cloud blog).
Social Media Brand Interactions
Millennials don’t just watch brands on social media. They follow them, contact them for support, and share praise. The statistics below show which platforms they prefer for connecting with businesses and why they reach out.
70%
of Millennials are likely to connect with businesses on Facebook
64%
of Millennials are likely to connect with businesses on Instagram
33%
of Millennials are likely to connect with businesses on Twitter
Source: Content Science
- 60% of Millennials have used social media for customer service, by private message or public post on a brand’s page (Content Science).
- 42% of Millennials who reach out to brands on social do so to express love for a product or service, the most of any age group (Content Science).
Millennial Influencer Marketing Statistics
Influencers have become a common part of how Millennials find and evaluate products, though their pull varies by survey and by generation. The statistics below cover trust, purchase influence, and the role of peer recommendations.
Influencer Trust and Purchase Influence
The figures below come from several different surveys, so the percentages vary depending on how each study defined its audience and question. Some statistics cover all US respondents rather than Millennials alone, and the generational trust comparison is labeled directional. Broader influencer marketing statistics provide useful context for how these numbers compare across audiences.
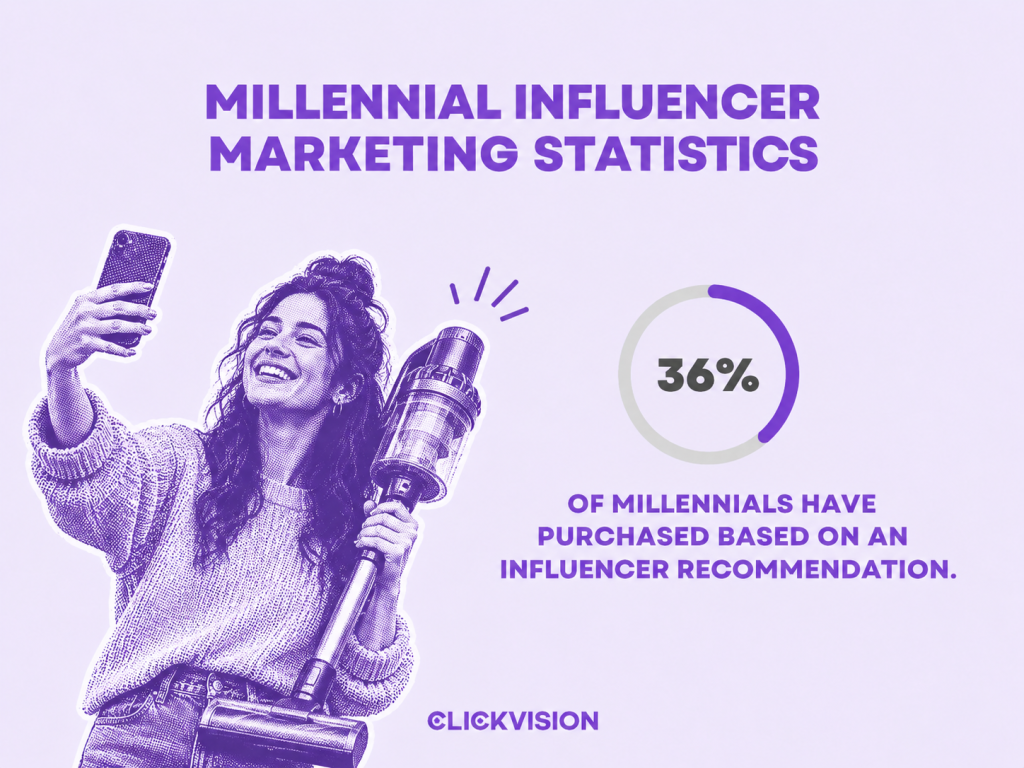
- 36% of Millennials have purchased based on an influencer recommendation (EMARKETER).
- 21% of Millennials rely on influencer reviews before buying (SAP Global Consumer Products Engagement Report, via SAP Engagement Cloud blog; consumer products shoppers).
- 15% of Millennials buy products after seeing influencer reviews (SAP Customer Loyalty Index 2025, via SAP Engagement Cloud blog).
- 14% of Millennials become more loyal when influencers endorse brands (SAP Customer Loyalty Index 2025, via SAP Engagement Cloud blog).
- Millennials’ trust in influencer recommendations is about 44%, versus roughly 55% for Gen Z and about 28% for Boomers (2025 generational study, via Review42).
- 70% of US respondents say they follow an influencer on social media (Content Science).
- One-third of US respondents say influencers affect their buying decisions (Content Science).
- For US Millennials, the share influenced by online personalities when buying rises to more than half (Content Science).
Peer Recommendations
Recommendations from people they trust can carry more weight with younger shoppers than traditional advertising. The statistic below covers “Zillennials,” a cohort that blends younger Millennials and older Gen Z, so it isn’t specific to Millennials alone.
- 72% of Zillennials trust recommendations over ads when shopping (EMARKETER). The cohort is “Zillennials,” not Millennials alone.
Millennial Advertising and Media Statistics
Millennials respond to advertising, but where and how they see it matters. The statistics below cover ad receptiveness, video and streaming habits, news and audio consumption, content format preferences, and how they like brands to contact them.
Ad Receptiveness
Millennials are open to advertising when it leads to a clear purchase decision. The statistics below show how often ads, product videos, and social reviews push them to buy.
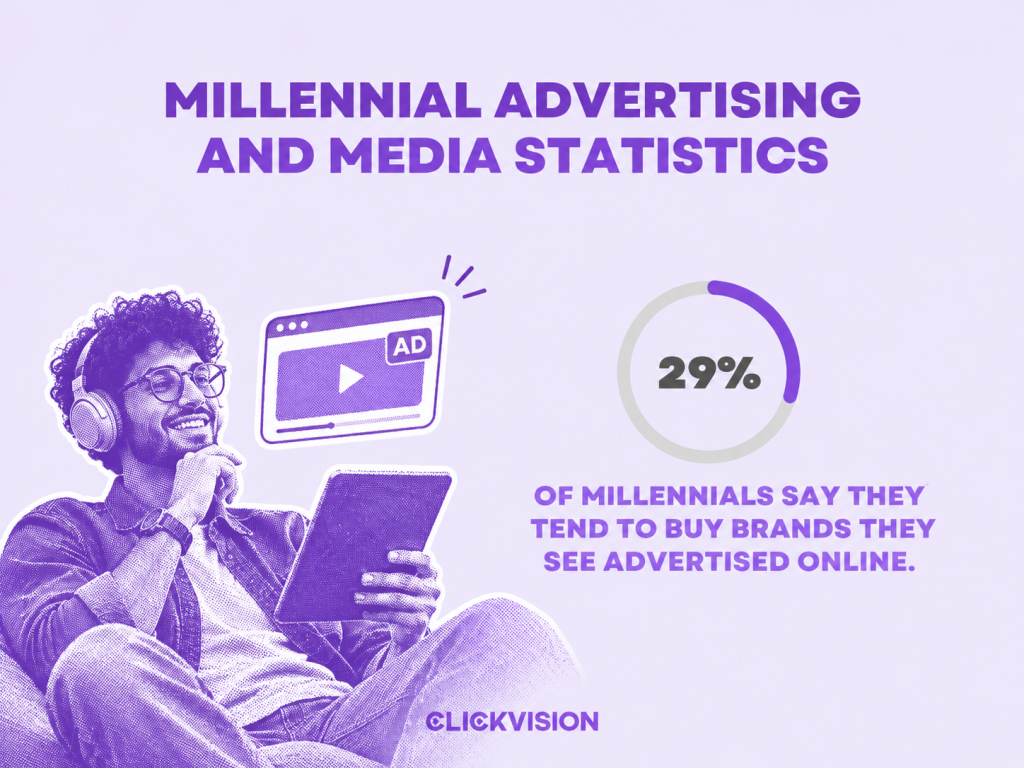
- 29% of Millennials say they tend to buy brands they see advertised online (GWI, via Content Science).
- Millennials are the generation most likely to buy after seeing an ad, watching a product video or reading a social media review (Sprout Social, via Content Science).
Video, Streaming and CTV
Video is a core part of Millennial media habits, spanning YouTube, streaming services, and connected TV (CTV). The figures below come from several sources, and some are directional or cover all US viewers, as noted in each bullet.
- Millennials average 45 minutes per day on YouTube in 2026 (EMARKETER).
- There are 62.3 million Millennial YouTube viewers, just behind Gen Z’s 65.1 million (EMARKETER forecast).
- Millennials make up the largest cohort of CTV viewers (EMARKETER).
- Roughly 95% of Millennials watch streaming services (2025 survey, via Review42; labeled directional).
- About 23% of adults aged 30 to 49 still subscribe to cable or satellite (separate 2025 survey, via Review42).
- Streaming accounted for 47.5% of TV viewing in December 2025, versus 20.2% for cable (Nielsen The Gauge). This covers all US TV viewing.
- 37% of Millennials binge-watch daily (Comscore, via Content Science).
- YouTube is the preferred channel for video content for 35% of Millennials (Comscore, via Content Science).
News and Audio
Millennials get their news and audio content differently from older audiences, with a stronger lean toward digital and on-demand formats. The statistics below compare their habits with other age groups.
- Millennials spend an average of 12 minutes a day watching TV news, versus almost an hour for people aged 38 and older (Nielsen, via Content Science).
- 88% of Millennials rely on digital news (Nielsen, via Content Science).
- 62% of Millennials listen to podcasts monthly, versus 42% of Americans aged 12 and older (Edison Research, via Content Science).
Video and B2B Content Preferences
Millennials favor video for learning and problem-solving, and many are now senior decision-makers at the companies brands sell to. The statistics below show which content formats they find most useful, including in a business context.
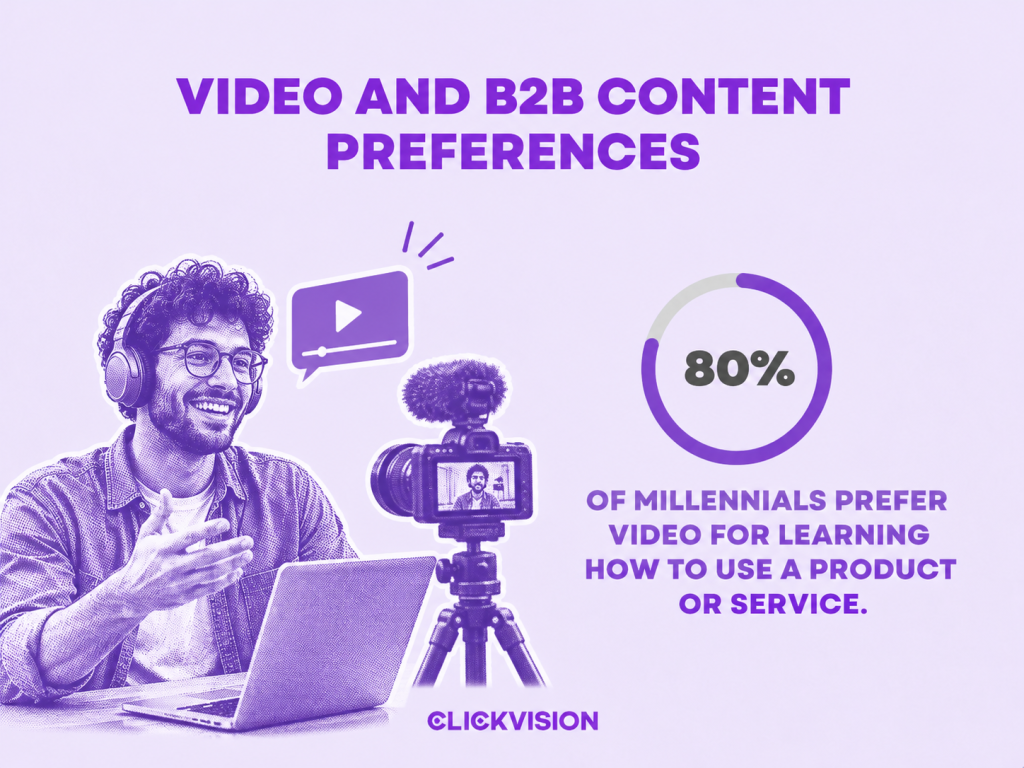
- 80% of Millennials prefer video for learning how to use a product or service (Brightcove, via Content Science).
- 81% of Millennials prefer video over written formats for troubleshooting (Brightcove, via Content Science).
- 70% of Millennials say video is the most helpful format for creating awareness of business-related problems (Brightcove, via Content Science).
- 80% or more of Millennials in senior decision-making roles want content on a seller’s products from peers, colleagues and the seller’s customers (Digital Commerce 360, via Content Science).
Text vs Email Contact Preferences
The best channel for reaching Millennials depends on the type of message. The statistics below come from a December 2025 SimpleTexting survey of over 1,400 US consumers, including 754 Millennials and 673 Gen Z.
- For appointment reminders, 63% of Millennials prefer text and 28% prefer email (SimpleTexting, December 2025, via Review42). SimpleTexting surveyed over 1,400 US consumers, including 754 Millennials and 673 Gen Z.
- For shipping and order updates, 48% prefer text and 41% prefer email (SimpleTexting, December 2025, via Review42).
- For coupons and discounts, 27% prefer text and 53% prefer email (SimpleTexting, December 2025, via Review42).
- For customer service, 22% prefer text and 53% prefer email (SimpleTexting, December 2025, via Review42).
- About 90% of surveyed Gen Z and Millennial consumers want brand texts once a week or less, with every other week the most popular cadence (SimpleTexting, via Review42).
Millennial Brand Loyalty Statistics
Millennial loyalty is earned through value and experience rather than habit. The statistics below cover what keeps them coming back and how loyalty programs and brand apps fit in.
Loyalty Drivers
Product quality, customer service, and rewards all play a part in keeping Millennials loyal to a brand. Personalization ranks lower for now, though SAP notes that it is rising.
- 56% of Millennials say product quality is the top driver of their loyalty (SAP Customer Loyalty Index 2025, via SAP Engagement Cloud blog).
- 48% of Millennials remain loyal because of excellent customer service (SAP Customer Loyalty Index 2025, via SAP Engagement Cloud blog).
- 49% of Millennials say discounts and rewards influence their loyalty (SAP Customer Loyalty Index 2025, via SAP Engagement Cloud blog).
- Only 17% of Millennials say personalization drives their loyalty, though SAP says this is rising (SAP Customer Loyalty Index 2025, via SAP Engagement Cloud blog).
- 62% of Millennials say they are likely to remain loyal customers through consistent engagement with a brand (Content Science).
Loyalty Programs and Brand Apps
Loyalty programs and brand apps give Millennials a convenient way to engage with the brands they favor, especially on mobile. Some figures below are labeled directional, and the last two cover all consumers rather than Millennials alone.
- 37% of Millennials show loyalty by downloading and using brand apps (SAP Customer Loyalty Index 2025, via SAP Engagement Cloud blog).
- 34% of Millennials express loyalty through social media engagement (SAP Customer Loyalty Index 2025, via SAP Engagement Cloud blog).
- 85% of Millennials prefer to access rewards on their smartphone (Capital One Shopping, via Review42).
- About 49% of Millennials are in a preferred brand’s loyalty program (industry surveys, via Review42; labeled directional).
- Millennials are 278% more likely than Boomers to increase spending with a brand after joining its loyalty program (loyalty-industry research, via Review42; labeled directional).
- 76% of consumers say they spend more on brands with a loyalty program (Capital One Shopping, via Review42).
- The average consumer has 9.3 active loyalty program accounts (Capital One Shopping, via Review42).
Millennial Consumer Values Statistics
Millennials increasingly expect brands to reflect their values, and many weigh those values when deciding what to buy. The statistics below cover sustainability, ethical shopping, and a preference for experiences over products.
Sustainability and Ethical Shopping
Many Millennials say sustainability matters to them, and some are willing to pay more for it. Several figures below come from global surveys, and the PwC figure covers all consumers and reflects stated willingness rather than observed spending.
- 74% of Millennials believe companies should be environmentally sustainable (EMARKETER).
- 47% of Millennials consider sustainability and ethical sourcing when shopping for apparel (EMARKETER).
- 63% of Millennials say they are willing to pay more for environmentally sustainable products or services (Deloitte 2025 Gen Z and Millennial Survey, via Review42). The survey is global: 8,731 Millennials born 1983 to 1994, across 44 countries.
- About 25% of Millennials have researched a company’s environmental impact before a purchase or job decision (Deloitte 2025 Gen Z and Millennial Survey, via Review42). Same global survey and cohort definition as M097.
- Consumers said they were willing to pay an average sustainability premium of 9.7% for sustainably produced or sourced goods (PwC Voice of the Consumer Survey 2024, via Review42). This covers all consumers: over 20,000 respondents in 31 countries and territories. It is a stated willingness, not observed spending.
Experiences vs Products
Millennials often put a higher priority on what they do than on what they own. The statistic below shows how that preference translates into spending.
- Nearly 60% of Millennials prefer spending money on experiences over products (EMARKETER).
Millennial Technology and AI Adoption Statistics
Generative AI is becoming another tool consumers can use when researching products and making purchasing decisions. Comparing Millennial adoption with Gen Z marketing statistics offers a useful generational perspective, particularly as brands evaluate how younger audiences interact with emerging technology.
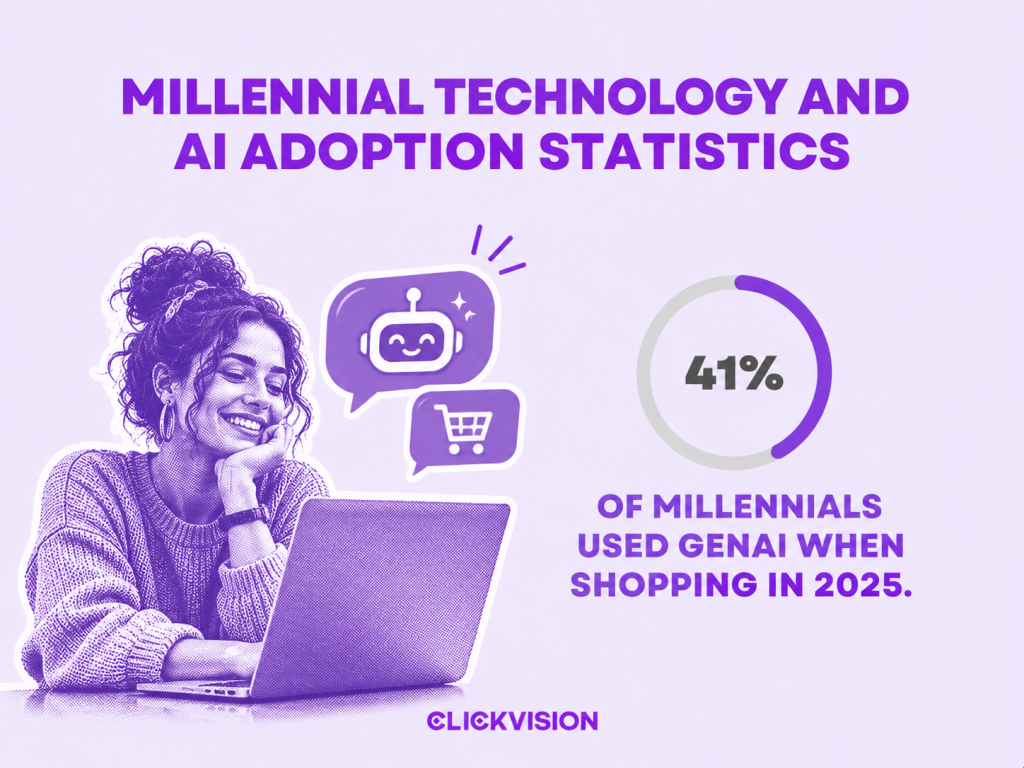
- 41% of Millennials used GenAI when shopping in 2025, versus 45% of Gen Z (EMARKETER).
- Roughly half of Millennials reportedly used an AI assistant or chatbot to help with an online purchase in Q1 2025 (industry surveys, via Review42; labeled directional).
Millennial Healthcare Consumer Statistics
Millennials are an important audience for healthcare providers, particularly when it comes to digital appointment booking and researching medical services online. These habits also connect to broader healthcare marketing statistics on patient acquisition, online visibility, and how people choose healthcare providers.
- Millennials accounted for 46% of all patient bookings on Zocdoc in 2025 (EMARKETER).
- 68% of Millennials look up information on healthcare providers online, more than any other generation (EMARKETER Digital Health survey, January 2025).
Millennials vs Other Generations Statistics
Putting Millennial behavior next to other generations shows where they stand out and where the gaps are narrower than they might seem. The statistics below compare spending and platform usage.
Spending Comparisons
Millennials outspend Gen Z by a wide margin today, but Gen X still leads the world in total spending. The Millennial overtaking point below is a projection, not a current result.
- Millennial total household expenditures are 55.6% higher than Gen Z’s, or about 1.56x (Capital One Shopping, via Review42).
- Gen X leads global spending at $15.2 trillion as of 2025 (EMARKETER).
- Millennials are projected to overtake Gen X as the highest-spending generation globally by the mid-to-late 2030s (EMARKETER)..
Platform Usage Comparison
Facebook shows that older Millennials remain heavier users of some platforms than the youngest adults. The comparison below uses age bands from Pew Research Center, so it approximates generational differences rather than measuring them exactly.
- 80% of adults aged 30 to 49 use Facebook, versus 68% of adults aged 18 to 29, a 12-point difference (Pew Research Center, 2025, via Review42;).
Conclusion
The Millennial marketing statistics reveal a generation with considerable spending power and changing priorities. Millennials are active across digital channels, but their purchasing decisions involve more than convenience or online trends. Product quality, customer service, financial concerns, and personal recommendations all influence how they respond to brands.
For marketers, the takeaway is to look beyond generational stereotypes and focus on what the data actually shows. Different behaviors call for different approaches, and not every trend applies equally to all Millennials. By considering these findings alongside their sources and research dates, businesses can better understand this audience and make more informed marketing decisions.