
Pinterest is more than a place to save recipes, home ideas, and shopping inspiration. It’s also a platform where millions discover products, explore brands, and plan purchases. But how much of that activity translates into real marketing opportunities? The latest Pinterest marketing statistics offer a closer look at who uses the platform and how their behavior is changing.
For marketers and businesses, understanding these numbers can help put Pinterest’s potential into perspective. In this article, we’ll explore key statistics on audience growth, user demographics, engagement, advertising, and shopping behavior. You’ll also find insights into search activity, platform revenue, and emerging trends shaping Pinterest in 2026.
Pinterest Platform Position and Business Adoption
These figures place Pinterest against other platforms and show how many businesses use it. Marketer surveys describe business behavior, not the behavior of Pinterest users.
Platform Rank and Social Reach
- As of early 2025, Pinterest ranks 15th among social media platforms globally by monthly active users. (Source: Statista);
- Around 31% of all social media users globally have a presence on Pinterest. (Source: Sprout Pulse)
Business Adoption
HubSpot State of Marketing 2026, as cited in the Hootsuite article.
| Group or platform | Share of companies using it for marketing |
| Pinterest, all companies | 22% |
| Pinterest, small and midsize businesses | 25% |
| Pinterest, enterprises | 20% |
| Reddit (comparison) | 15% |
| Snapchat (comparison) | 25% |
The small business and enterprise rows are marked as implied in the article. (Source: HubSpot)
Customer Satisfaction and Service
- Pinterest scored 78 on the American Customer Satisfaction Index in 2025.(Source:BusinessWire, 22 Jul 2025)
- Just 8% of social media users say Pinterest is the network they are most likely to use to contact a brand during the holidays (Source:Sprout Social)
Pinterest Company Financial Performance
Revenue figures are company-reported and are the most dependable business benchmarks in this report. They describe Pinterest as a company, not the results an individual advertiser should expect.
Pinterest Revenue and Revenue Growth
| Quarter | Revenue |
| Q1 2025 | $855 million |
| Q4 2025 | $1.319 billion |
| Q1 2026 | $1.008 billion |
Sources: Pinterest Q1 2026
- Q4 2025 revenue grew 14% from the previous year. (Source: Pinterest Q4 and full-year 2025)
- Q1 2026 revenue grew 18% year over year. (Source: Pinterest Q1 2026)
- Pinterest’s full-year 2025 revenue was $4.222 billion. The source article stated the unit as millions; the earnings release shows billions, so the unit is corrected. (Source: Pinterest Q4 and full-year 2025)
- Full-year 2025 revenue was up 16% from 2024. (Source: Pinterest Q4 and full-year 2025)
Pinterest Revenue Growth by Region
| Region | Q1 2026 revenue growth (year over year) |
| United States and Canada | 13% |
| Europe | 27% |
| Rest of world | 59% |
Growth rates are relative changes. They show where revenue is expanding fastest, not the size of each region. Source: Pinterest Q1 2026 earnings release and 10-Q (4 May 2026).
Pinterest User and Audience Statistics
Pinterest reports audience size as monthly active users (MAU), meaning people who were active on the platform in a 30-day window. The figures below are the company-reported series, so they can be compared from one period to the next.
Pinterest Monthly Active Users and Growth
| Period | Monthly active users |
| Q4 2024 | 553 million |
| Q1 2025 | about 570 million |
| Q4 2025 | 619 million (an all-time high) |
| Q1 2026 | 631 million |
The Q4 2024 and Q1 2025 figures are the prior-year comparators published in Pinterest’s later earnings releases. Some source articles present them as current, which they are not. (Sources: Pinterest)
- Q4 2025 was the platform’s 10th consecutive quarter of record-high MAUs. (Source: Pinterest)
- MAU grew 12% year over year in Q4 2025 (a relative percentage change, not percentage points). (Source: Pinterest)
- MAU grew 11% year over year in Q1 2026 (a relative percentage change). (Source: Pinterest)
- The number of people who use Pinterest has nearly doubled since 2018, growing by over 300 million social media users in seven years. (Source: Statista)
Pinterest Gender and Household Income Profile
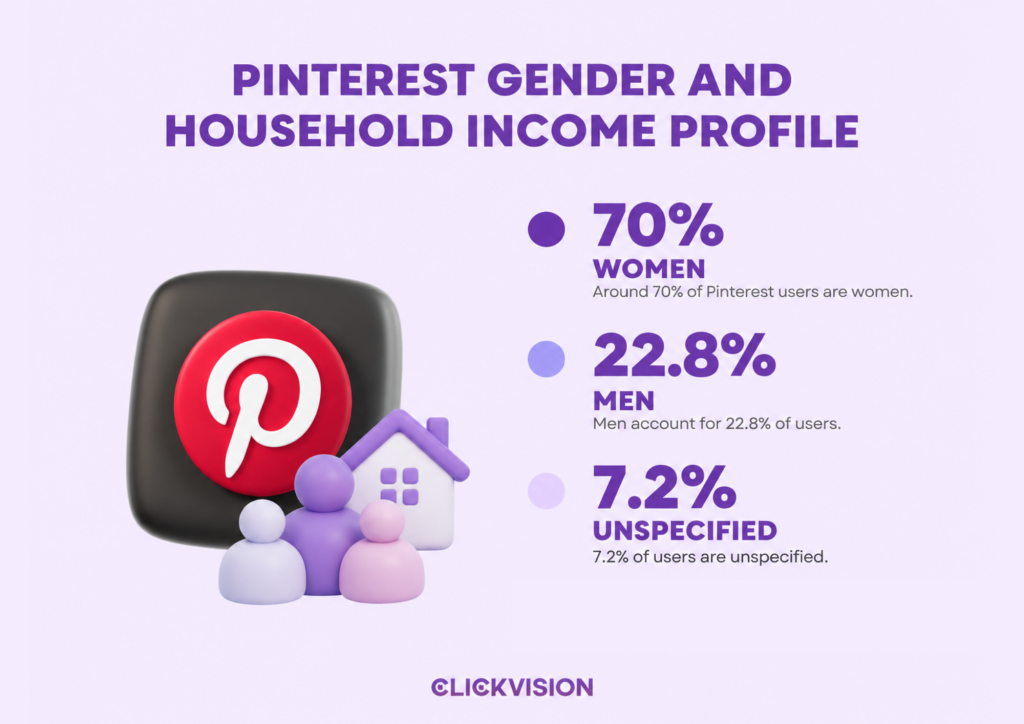
- Around 70% of Pinterest users are women. (Source: Statista)
- Men account for 22.8% of users. (Source: Statista)
- 7.2% of users are unspecified. (Source: Statista)
- Pinterest reaches 40% of US households with annual income over $150,000. (Source: Pinterest)
Pinterest Users by Age
The Hootsuite article reports these DataReportal figures as usage percentages by age band and gender without defining the denominator, so treat them as relative comparisons.
| Age band | Women | Men |
| 16-24 | 45.1% | 27.7% |
| 25-34 | 31.1% | 20.8% |
| 35-44 | 25.6% | 17.1% |
| 45-54 | 24.5% | 16.9% |
| 55-64 | 24.5% | 15.0% |
| 65+ | 26.5% | 11.0% |
Source: DataReportal, as reported in the Hootsuite article;
- Only 5.4% of users are aged 65 and over. This is a share of all users, so it is a different measure from the age-band table above. (Source: DemandSage)
- Pinterest reaches 46% of people aged 18 to 24 in the United States. (Source: Statista)
Pinterest Generational Adoption
Sprout’s Pulse Survey (Q2 2025) reports the share of each generation using Pinterest.
| Generation | Share on the platform |
| Gen Z | 39% |
| Millennials | 32% |
| Baby Boomers | 28% |
| Gen X | 26% |
(Source: Sprout Social)
Pinterest Usage by Geographic Market
Country figures mix two measures: the share of a national population using Pinterest and absolute user counts. They come from different sources and dates.
Population Penetration by Country
Statista figures as cited in the Hootsuite article; the first entry carries an October 2025 date. The Netherlands value is far above every other country and has not been independently checked.
| Country | Share of population |
| Netherlands (highest) | 65.3% |
| Finland | 36.8% |
| Malta | 36% |
| Czechia | 34.2% |
| Luxembourg | 33.9% |
| Cyprus | 33% |
| United States | 32.6% |
| Canada | 31.7% |
Source: Statista
User Counts by Country
- Germany and France take 4th and 5th place by users, with less than 20 million users each. (Source: Statista)
- The United Kingdom has roughly 15 million users. (Source: Searchlab)
Consumer Reach by Country
| Country | Share of consumers reached |
| United States | 33% |
| Australia | 32% |
| United Kingdom | 30% |
(Source: Sprout Pulse)
Pinterest Consumer Discovery Statistics
These findings describe how people research and discover products on Pinterest. They are survey and platform-reported behaviors, not measures of advertising effectiveness.
- Brand and product research is Pinterest’s top use case, cited by 36.4% of users. (Source: Hootsuite)
- 84% of Gen Z users who log in weekly discover products that fit their style and tastes. (Source: Oberlo)
- 80% of weekly Pinners say they feel inspired by the shopping experience. (Source: Hootsuite);
Pinterest Engagement Statistics
Behavior figures describe how audiences use the platform. They are descriptive and do not show that any marketing tactic caused a result.
Platform Usage and Intent
Time spent on Pinterest and stated plans to use it more in 2026.
- Users spend an average of 10 minutes per day in the app. Source: Hootsuite)
- 9% of consumers plan to use Pinterest more in 2026. (Source: Sprout Social)
- 13% of Gen Z plan to use Pinterest more in 2026. (Source: Sprout Social)
- 11% of Millennials plan to use Pinterest more in 2026. (Source: Sprout Social)
Engagement Rate by Pin Format
Benchmarks below are WebFX medians from US campaigns in 2024 and 2025. Sample sizes are not disclosed, so use them as directional ranges.
| Format | Engagement rate |
| Standard Pins | 0.15-0.25% |
| Collections | 0.2-0.4% |
| Video Pins | 0.3-0.5% |
| Idea Pins (a historical format) | 0.5-1% |
Source: WebFX
Saves and Save Rates
The weekly saves figure is a Pinterest-reported count of activity. The save rates are WebFX median benchmarks and are a different metric.
- Users save over 1.5 billion Pins each week. (Source: Sprout Social)
- Pinterest’s average save rate is between 0.2% and 0.5%. (Source: WebFX)
- Food, DIY and fashion Pins often reach save rates of 1% to 2%. (Source: WebFX)
Brand Content Interaction and Preferences
Sprout 2026 Content Strategy Report, as cited in the Sprout article. The question wording is not reproduced in the source article.
- Around 70% of Pinterest users interact with brand content at least once a week. (Source: Sprout Social)
- That rises to 78% among Gen Z. (Source: Sprout Social)
- When interacting with brands on Pinterest, consumers are most likely to engage with static images (38%). (Source: Sprout Social)
- They are next most likely to engage with Shoppable Pins (34%). (Source: Sprout Social)
- Pinterest users prioritize entertaining content (23%) above all else when it comes to what brands should post. (Source: Sprout Social)
- Educational product information follows (21%). (Source: Sprout Social)
- Influencer partnerships and customer service follow (both at 13%). (Source: Sprout Social)
Pinterest Traffic and Click Statistics
Website visits to pinterest.com and outbound clicks from Pinterest to other sites are separate metrics. Visits describe traffic arriving at Pinterest; outbound clicks describe traffic Pinterest sends to websites. Neither figure is a conversion or sales result.
- Pinterest receives over 1.3 billion visits per month. (Source: Semrush)
- 62% of visits to pinterest.com come from desktop. (Source: Semrush, 2026)
- The remaining 38% come from mobile. Source: Semrush, 2026)
- Pinterest generates 1.7 billion outbound clicks every month. (Source: Pinterest Q4 2025 earnings call (CEO statement)
Pinterest Search and SEO Statistics
Pinterest functions as a visual search engine, so search volume and discovery behavior are central to organic strategy.
Search Volume and Behavior
- Pinterest sees more than 80 billion searches every month, most of them visual (CEO statement, Q4 2025 earnings call). Source: Pinterest Q4 2025 earnings call (CEO statement).
- 96% of Pinterest’s top searches are unbranded. The origin of this figure was not located, and it applies to “top searches” rather than all searches. (Source: Hootsuite)
Description and Keyword Optimization
Pinterest’s business tips page, as cited in the Oberlo:
- Pinterest’s business tips page advises including the brand name in the first line of a description to get twice the awareness. The page’s method is not disclosed, so this is Pinterest’s own claim and does not establish causation.
- The same page advises mentioning special occasions and seasons to drive 10 times more awareness
Pinterest Content Strategy and Design Statistics
These figures cover how brands publish and how Pins are formatted. They are reported associations and do not show that a tactic caused a result.
- Brands publish an average of 10 posts per week on Pinterest. (Source: Statista, 2025)
- That is a jump of nearly 43% over 2024. (Source: Statista)
- Pinterest favors vertical images at the optimal 2:3 dimensions. (Source: Oberlo)
Pinterest Advertising Statistics
Advertising figures are benchmarks, not guarantees. Costs and conversion rates vary by category, season and campaign setup.
Pinterest Advertising Reach
Reach figures come from different sources and use different bases, so they are not interchangeable.
- Pinterest’s B2C ad reach covers 43% of US online adults. (Source: DemandSage)
- Pinterest’s advertising reach equals 6.1% of all internet users. (Source: Hootsuite)
- It equals 4.1% of the world’s total population. (Source: Hootsuite)
Pinterest Advertising Audience Growth by Platform
| Platform | Ad audience growth over the past year |
| 3.8% | |
| 13.1% | |
| TikTok | 17.6% |
| YouTube | 2.1% |
Year-over-year growth in advertising audience, with Pinterest alongside other platforms. Source: Statista, as reported in the Hootsuite article;
Pinterest Advertising Costs
- The average cost per click is between $0.50 and $1.50. (Source: WebFX)
- The cost per engagement is just $0.10 to $0.30. (Source: WebFX)
Pinterest Ad Conversion Rates
Conversion rates for promoted Pins, as reported by the source article.
- Promoted Pins typically see conversion rates of 2% to 4%. (Source: WebFX)
- For luxury and home goods the rate climbs to 5% to 8%. (Source: WebFX)
Pinterest Shopping and Ecommerce Statistics
These figures connect Pinterest activity to purchase behavior. They are survey and platform-reported associations and do not prove that Pinterest advertising caused the sales.
Shopper Spend and Basket Size
Pinterest Business shopping insights page, July 2021. The underlying study is not visible on the page, and the research is older than most figures in this report.
- Pinterest shoppers spend 80% more per month than people on other platforms. Source: Pinterest Business shopping insights page (7 Jul 2021)
- They also have 40% larger basket sizes. Source: Pinterest Business shopping insights page (7 Jul 2021)
Purchase Intent and Ecommerce Performance
The e-commerce site conversion rate is a different measure from the promoted Pin conversion rates in the advertising section and comes from a different source.
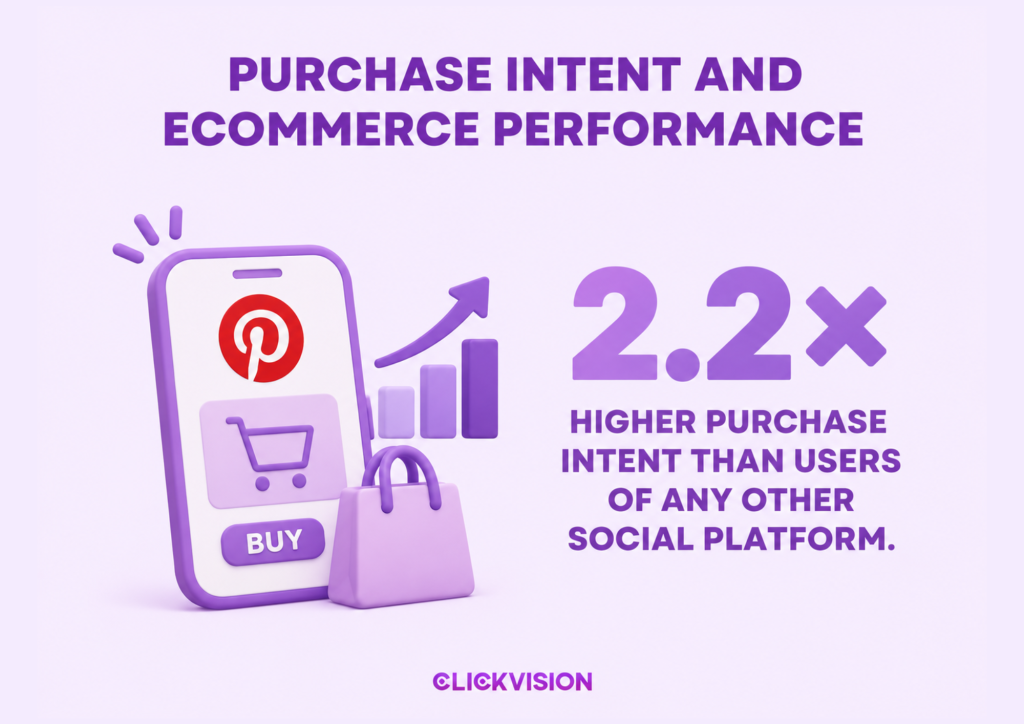
- Pinterest users show 2.2 times higher purchase intent than users of any other social platform. The article cites MarketingLTB, which in turn cites Pinterest. (Source: MarketingLTB)
- Pinterest shows a 1.8% e-commerce conversion rate, versus under 0.5% on Instagram and TikTok. (Source: Searchlab)
- E-commerce revenue driven by Pinterest in 2025 is listed at $3.65 billion. The source does not define whether this is attributed sales or another measure. (Source: Searchlab)
Pinterest Trend Statistics
Pinterest publishes annual trend forecasts from search data. The accuracy claim is Pinterest’s own.
Pinterest Predicts 2026
- Over the past six years, 88% of Pinterest’s trend predictions have come true. (Source: Pinterest Predicts 2026)
- The 2026 report identifies 21 emerging trends. (Source: Pinterest Predicts 2026)
- 67% of the 2026 Predicts trends are driven by Gen Z. (Source: Ypulse; PPC Land)
Summer 2026 Trend Search Growth
Pinterest Summer 2026 trend report, as cited by Hootsuite. The comparison period is not stated.
| Trend | Search growth |
| World Cup jerseys | 840% |
| Dad sneakers | 906% |
| Formula 1 aesthetic outfits | 483% |
Conclusion
Pinterest continues to grow as a platform where people discover ideas, explore products, and connect with brands. The latest Pinterest marketing statistics show how its audience, search activity, and shopping behavior create opportunities for businesses. However, understanding these figures means looking beyond user numbers and considering how people actually engage with content.
Ultimately, these statistics offer useful context for marketers planning their next steps on Pinterest. Whether you’re evaluating advertising costs, researching your audience, or refining your content strategy, the numbers can help guide your decisions. Just remember that platform-wide trends don’t guarantee individual results. The real value comes from understanding what the data means for your audience and goals.