
Every marketer has stood in a crowded conference hall and wondered whether the booth, the budget, and the long days on their feet were really worth it. The honest answer used to be a shrug. Now the numbers are finally catching up to the instinct, and they tell a more interesting story than most of us expected.
Below, we’ll break down the latest event marketing statistics from 2025 and 2026. You’ll learn how the industry is growing and which formats convert best. You’ll also see why proving ROI still trips up so many teams. Each figure comes with its original source, so you can use the data with confidence.
Event Marketing Effectiveness Statistics
Events remain an important part of many marketing strategies, particularly for businesses that depend on personal relationships and longer sales cycles. Their effectiveness can be measured in several ways, from how marketers perceive their value to their contribution to revenue and customer acquisition.
Perceived Event Channel Effectiveness
Marketers frequently compare events with other channels based on their ability to generate engagement, build relationships, and support business goals. The following figures show how professionals rate event marketing against other marketing activities.
- 72% of marketers ranked events as their company’s most effective marketing channel in 2024 (HockeyStack, 2025).
- 78% of organizers say in-person events are their most impactful marketing channel (Bizzabo).
- In-person events (21%) and thought leadership (20%) are seen as the most effective B2B marketing channels. (Mailmodo)
- Around 89% of businesses say that events are vital to achieving key business objectives, emphasizing the strategic role that live gatherings play in corporate marketing and growth plans. (Sweap)
Revenue Contribution and Leadership Perception
Beyond engagement, businesses increasingly expect events to contribute directly to sales and revenue. These statistics explore how marketing teams and company leaders assess the commercial impact of their event investments.
- 52% of marketers attribute at least half of their company’s 2024 closed-won deals to events (HockeyStack).
- 80%+ of leadership teams see events as impactful to pipeline and revenue. 44% call events “influential for pipeline, hard to measure”; 39% call them the “most important revenue channel”; only 10% call them too expensive or risky (Vendelux).
- Events represent only ~6% of total B2B deal volume, but their efficiency and downstream impact far exceed other channels on a per-deal basis (HockeyStack).
Marketer-Reported Sales Cycle Effects
Events can provide opportunities for buyers and sellers to connect directly, discuss requirements, and address questions. Marketer surveys suggest these interactions may help accelerate certain deals, although reported improvements do not necessarily establish a causal relationship.
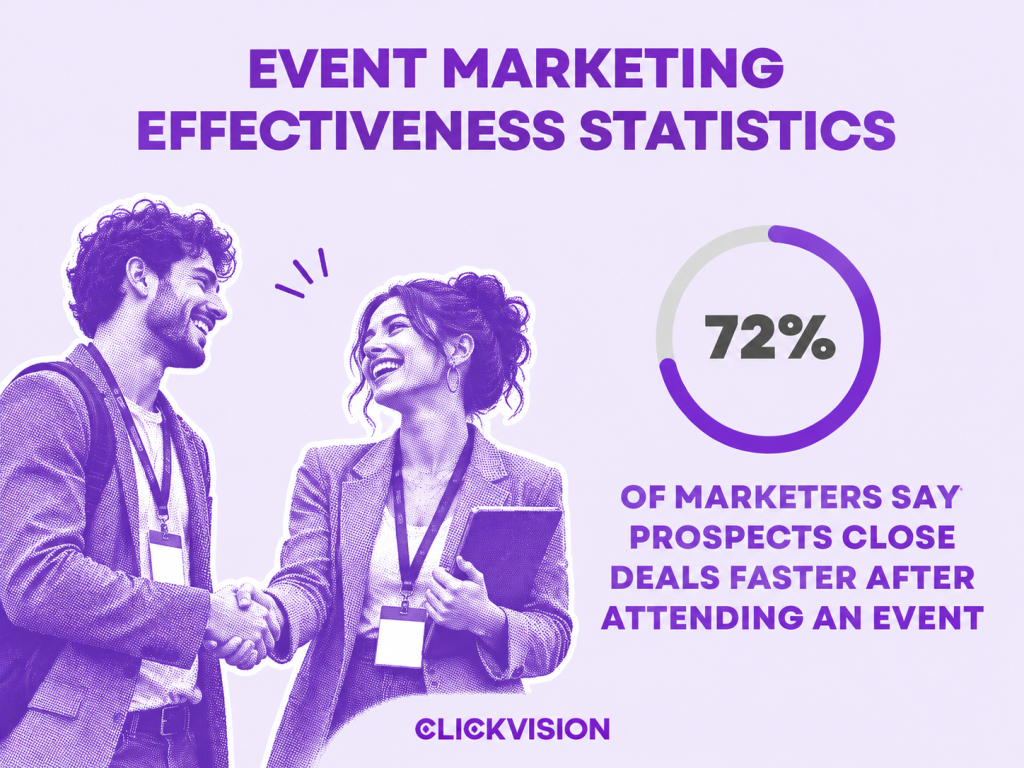
- 72% of marketers say prospects close deals faster after attending an event (HockeyStack).
- 31% of marketers report a 20-30+ day decrease in sales cycle for event-sourced deals (HockeyStack).
Event Goals and Team Priorities
- 61% of marketers cite lead generation as the top objective for B2B events, and 66% cite sales (Thunderbit).
- 24% of organizers say “grow sales pipeline” is the #1 goal for B2B conferences (Bizzabo).
- The primary goal of in-person events is relationship building (39%) (Kaltura).
- Primary goals of virtual events: learning about the company/product (36%) and general education (36%). (Kaltura)
- Over 90%: B2B event teams who rank audience quality, ROI measurement and follow-up as top priorities. (Thunderbit)
- 92% of event teams are prioritizing better post-event engagement (Bizzabo).
Event Lead Conversion Statistics
Generating interest is only the beginning of the event marketing process. What matters is whether those contacts become qualified opportunities and eventually customers. The following event lead conversion statistics examine performance at different stages of the sales funnel, including differences between virtual and in-person formats.
Creation-to-Qualified Conversion by Event Format
Virtual and in-person events can produce different results during the lead qualification stage. These figures compare their conversion rates with the broader marketing channel average, offering a clearer picture of how effectively event-generated contacts progress.
| Marketing channel | Lead-to-qualified conversion |
| Virtual events | 6.41% |
| In-person events | 5.50% |
| Other marketing channels | 4.82% |
Source: HockeyStack
- Virtual events convert to qualified opportunities 33% more efficiently than other channels despite representing less than 3% of deal volume (HockeyStack).
Opportunity-to-Close and Closed-Won Conversion
Lead qualification does not guarantee a sale. These statistics look further down the funnel, examining how event-generated opportunities progress into closed deals. The findings cover different conversion stages and reporting periods, so they should not be treated as directly interchangeable.
- Event-sourced leads deliver 40% opportunity-to-close conversion, the strongest bottom-of-funnel performance of any channel studied (HockeyStack).
- Virtual B2B events averaged 14.2% creation-to-closed-won conversion in H1 2025, peaking at 31.6% in January and dipping to 6.27% in August (HockeyStack).
- In-person B2B events averaged 12.1% close rates throughout 2025, peaking at 16.92% in May and bottoming at 8.12% in August (HockeyStack).
Event Marketing ROI and Measurement Statistics
Measuring event marketing ROI remains a major challenge, even as businesses continue investing in live experiences. Events can influence purchasing decisions across multiple interactions, making it difficult to isolate their contribution. The following statistics explore the gap between perceived value, measurable returns, and the tools used to evaluate performance.
Proving Event ROI and Attribution Gaps
Many marketing teams believe events contribute to revenue but struggle to demonstrate that contribution through their reporting systems. These findings highlight the challenges of connecting event participation with pipeline activity, closed deals, and financial outcomes.
98%
of teams struggle to justify event spending to leadership
Including AI Overviews
86%
can’t accurately attribute ROI to events
22%
say event impact is fully visible to revenue leaders
Source: Vendelux, Vendelux 2026 B2B Events Survey
- 62% of marketers struggle with event ROI measurement, citing it as the biggest barrier to defending event budgets (Forrester).
- 40% of organizers still find it difficult to prove ROI in 2026—an improvement on the 70% reported for 2025, but hardly a solved problem (Bizzabo).
- 90% say events influence deals that never get credit in their CRM. 85% report events influence uncredited deals “occasionally or often”; only 3 respondents out of 120+ said events always get proper credit (Vendelux 2026 B2B Events Survey).
- The most persuasive proof for securing event investment is attributed pipeline from past events (90%), target accounts/decision makers attending (72%), audience composition/ICP match (68%), and meetings booked pre-event (57%) (Vendelux 2026 B2B Events Survey).
Perceived ROI by Event Format
Different event formats offer different advantages, from face-to-face relationship building to the wider accessibility of virtual experiences. Marketers’ perceptions of ROI vary accordingly, although survey differences make direct comparisons difficult.
These two findings come from different surveys and populations, so they should not be read as a head-to-head comparison.
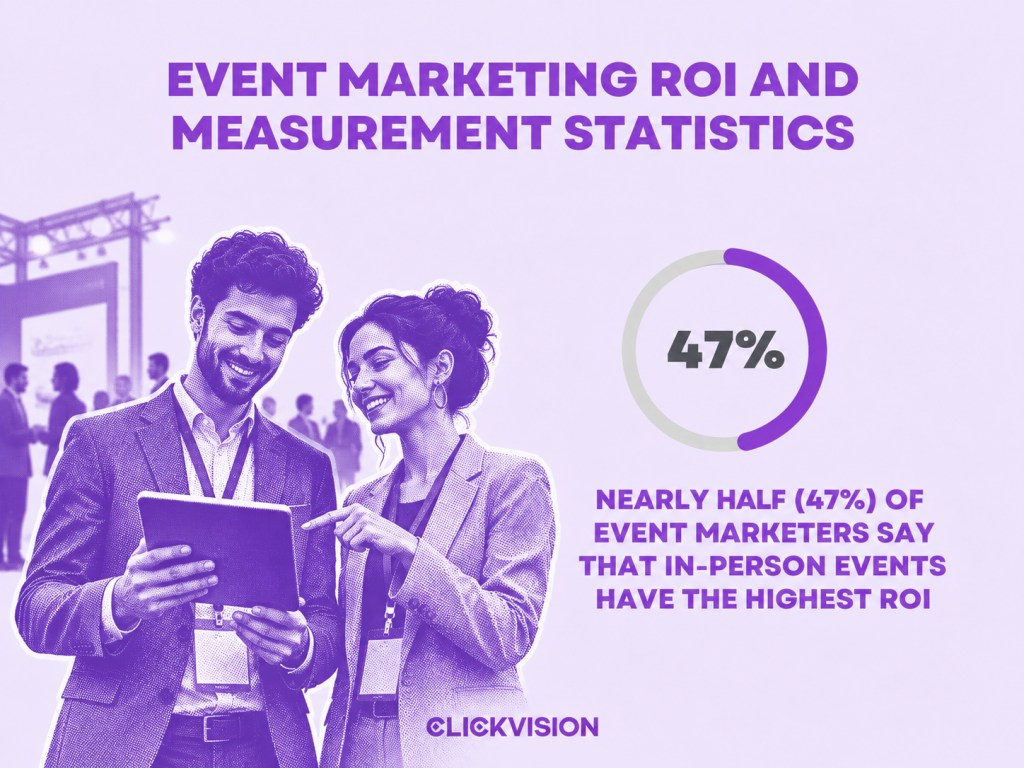
- Nearly half (47%) of event marketers say that In-person events have the highest ROI (NextGen)
- Over 25% of organizations report higher ROI and engagement from virtual events. (Kaltura)
Measurement Methods and Obstacles
Event organizers rely on various platforms and reporting methods to evaluate performance. However, limited resources, disconnected systems, and incomplete sales data can prevent teams from understanding how their events contribute to business results.
- 61% of marketers use event management software to measure event success (Gitnux). (Thunderbit)
- Biggest obstacles to event ROI measurement, per the Vendelux 2026 survey: 64% cite limited post-event sales visibility, 55% cite attributing pipeline and revenue, 38% cite poor CRM integration (Vendelux 2026 B2B Events Survey).
- Approximately 26% of event marketers say they lack the time to effectively measure the success of their events. (Momencio)
Event Planning, Outreach and Attendance Growth Statistics
Successful events depend on more than what happens during the event itself. Choosing the right audience, contacting prospects early, and encouraging attendance all influence the outcome. For event promotion through social platforms, social media marketing statistics can provide additional context for selecting channels and evaluating audience engagement. These statistics examine common planning challenges and how organizations approach event selection and pre-event engagement.
Pre-Event Outreach
- 55% of teams begin outreach less than four weeks before an event
- 70% cite limited attendee-list visibility as their top barrier to booking meetings
Event Selection and Planning
- 13% rate their event selection process as fully data-driven
- 2.75/5 average rating for visibility into attendee data before an event
Source: Vendelux 2026 B2B Events Survey
- Pre-event planning determines 76% of attendee agendas before arrival. (Momencio)
- Over 52% of event planners cite increasing attendance as their biggest challenge. (G2)
Event Venue and Location Statistics
Venue selection can shape both the attendee experience and the overall event budget. Organizers must balance location, accessibility, availability, and cost while coordinating with potential venues. The following statistics highlight current sourcing challenges and changing preferences in event locations.
- Over 43% of event planners use platforms like Facebook, WhatsApp, and Slack event communities to find venues. (G2)
- Approximately 46% of organizations held their internal meetings in a city outside of their headquarters’ location. (G2)
- About 42.6% of organizers report that receiving timely venue proposals is their largest venue sourcing challenge. (G2)
- Efficiency is the name of the game: Planners are moving meetings to secondary markets (53% considering it) to save costs (Bizzabo), and sponsorships are a growing revenue stream. (Thunderbit)
Attendee Experience and Engagement Statistics
Attendance alone does not determine whether an event is successful. Participants also evaluate the quality of interactions, opportunities to learn, and overall experience. These statistics explore what attendees expect, how events influence their perception of brands, and which factors affect their participation decisions.
Attendee Experience Expectations and Interactivity
Modern event attendees often expect more than presentations and scheduled sessions. Interactive activities, networking opportunities, and flexibility can influence how they evaluate an event. The following findings reveal differences between attendee preferences and the experiences organizers provide.
74%
of attendees value immersive experiences
73%
prefer in-person schedules with free time
23%
say their latest in-person event had plenty of interactive sessions
Source: Bizzabo
- 69% of event attendees prefer events that offer a “meaningful, transformative experience.” (Eventbrite)
- 27% experienced gamification elements, and 30% felt there were abundant networking opportunities (Bizzabo).
- Only 3% of attendees say networking and social spaces influence buying decisions. (Kaltura)
Brand Trust, Perception and Connection After Events
Live experiences can create personal connections that extend beyond the event itself. These statistics examine how attending events and interacting with brands can influence trust, positive impressions, and feelings of community.
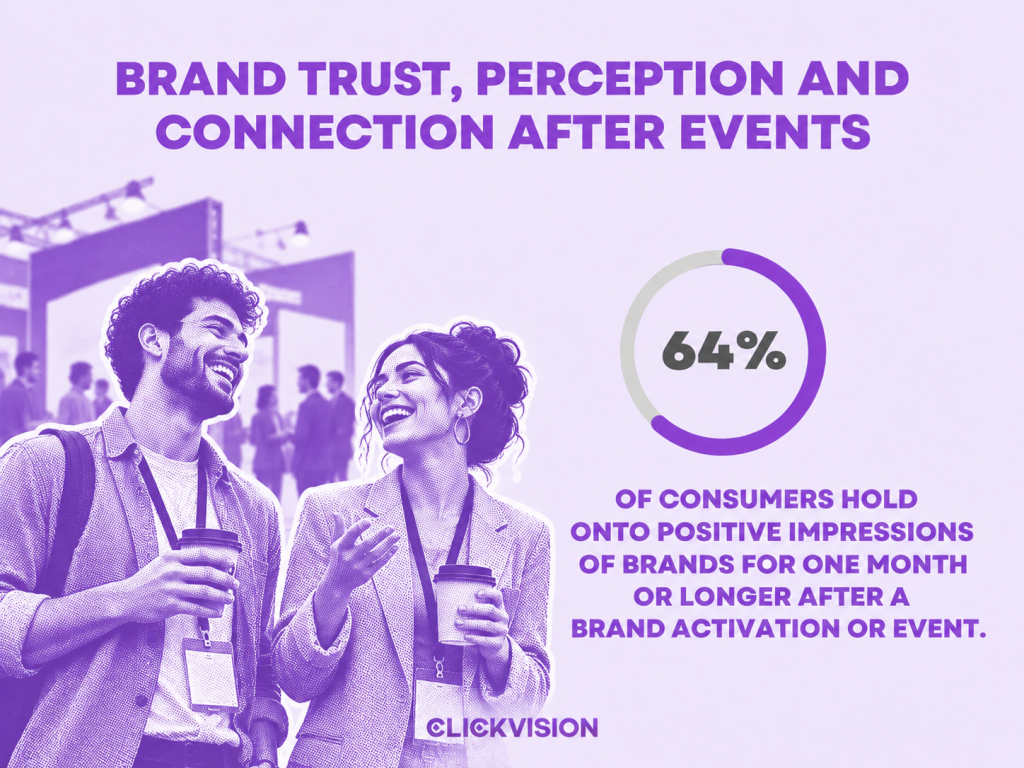
- 64% of consumers hold onto positive impressions of brands for one month or longer after a brand activation or event. (ATN Event Staffing)
- 77% of consumers say that interacting with a brand at a live event increases their trust in the brand. (Freeman)
- Nearly 55% of Americans report that attending events makes them feel more connected to others and their communities. (G2)
Attendee Segments and Event Selection Factors
Not every attendee approaches events with the same priorities. Generational preferences, travel considerations, and destination characteristics can all influence participation. For organizers targeting younger audiences, Gen Z marketing statistics offer additional context about this generation’s broader consumer behavior and marketing preferences. Understanding these differences helps organizers make more informed decisions about their audiences.
- More than 61% of millennials and 63% of Gen Z attendees plan to attend more global events in 2026 and beyond. (G2)
- About 28% of event attendees consider the region’s safety and health protocols when selecting whether to attend an event in that location. (G2)
Event Format Mix Statistics: In-Person, Virtual and Hybrid
Event organizers now have several ways to reach their audiences, each with different advantages and limitations. In-person experiences remain prominent, while virtual and hybrid formats continue to serve specific needs. The following statistics examine how frequently these formats are used and how organizers plan to approach them.
Share of Events by Format
The balance between in-person, virtual, and hybrid events has changed considerably since the pandemic. Recent figures show how event formats are distributed and which approaches marketers are incorporating into their strategies.
63%
In-person events
33%
Virtual events
4%
Hybrid events
Source: Bizzabo
- The comeback of in-person events: After a forced hiatus, live events are back in a big way. In 2024, 60% of events were held in-person (Bizzabo).
- Over 80% of meetings in 2024 included in-person component. (G2)
- In-person events are a proven money maker, which is why 83% of event marketers include them in their strategy. Here’s a full breakdown of what kind of events marketers are executing:
- 43% run a mix of in-person and virtual events
- 30% only run in-person events
- 11% only run hybrid events
- 9% run a mix of in-person, hybrid, and virtual events
- 6% only run virtual events
Marketer Confidence by Event Format
Organizing an in-person conference requires different capabilities than delivering a webinar or hybrid experience. These statistics examine how confident marketers feel about executing different formats and where they report greater difficulties.
- 97% of marketers believe they’re effective at running in-person events, with 44% saying they’re “very effective.” Overall, marketers are far less confident in their ability to run other event types.
- Only 12% believe they’re very effective at executing Virtual events, with 79% claiming to be at least moderately effective. 8% are very effective at executing hybrid events and 14% are very effective at running webinars.
Organizer and Marketer Plans for Future Events
Current event formats provide one view of the industry, but future investment plans offer another. These statistics highlight whether organizers intend to expand, maintain, or adjust their event programs in the coming years.
- 86.4% of event organizers plan to maintain or increase the number of in-person events in 2026 compared to last year (Bizzabo).
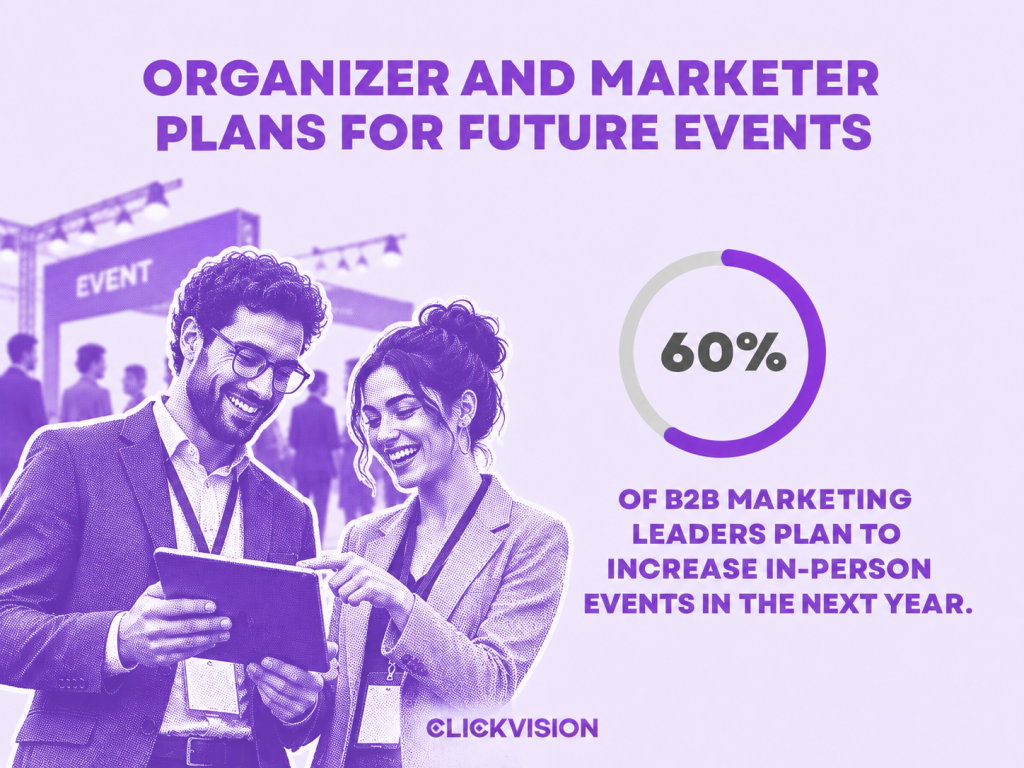
- 60% of B2B marketing leaders plan to increase in-person events in the next year. (Mailmodo)
- 78% of event marketers are committed to hosting on-site events in the future. (Upmetrics)
- 40% plan to run more events in 2026 than the year before, with another 40% holding flat (Bizzabo).
In-Person Event Statistics
In-person events continue to attract significant attention from marketers, organizers, and attendees. Their ability to bring people together creates opportunities for networking, education, and business development. The following figures explore organizational support, attendee preferences, and recent attendance trends.
Organizer Support and Perceived Importance of In-Person Events
Business leaders and event organizers often view face-to-face gatherings as an important component of their marketing strategies. These figures examine the level of organizational support behind in-person conferences and their perceived contribution to business success.
- 79.8% of B2B organizers say in-person conferences are critical to their organization’s success (Bizzabo).
- 72.7% of organizers say their C-suite actively supports in-person event strategies (Bizzabo).
Attendee Preferences and In-Person Attendance Trends
For many attendees, meeting industry peers and learning directly from experts remain important reasons to attend conferences. These statistics examine the preference for physical events, changes in attendance, and the benefits participants associate with being there in person.
- 82%: Attendees who prefer in-person events over virtual (Bizzabo).
- 54% of attendees plan to attend more in-person events than they did last year (Bizzabo).
- Only 10% of event pros think reduced in-person attendance is a permanent problem (Bizzabo).
- Attendance at in-person B2B conferences is rising, with 57% of organizers reporting growth (Bizzabo).
- 72% of attendees say in-person conferences give them the best networking opportunities (Bizzabo).
- 70% rate in-person events as the best source of training and professional content (Trade Show Executive).
- 71% of attendees say in-person B2B conferences are the most effective way to learn about new products and services (Bizzabo).
Virtual and Hybrid Event Statistics
Although in-person events have regained momentum, virtual and hybrid experiences remain part of the events industry. They offer alternative ways to deliver content and connect with audiences, but also introduce challenges related to engagement and execution. The following statistics explore market growth, adoption, and future expectations.
Virtual Event Market, Adoption, Perception and Challenges
Virtual events have developed into a substantial market with their own technology requirements and audience expectations. These figures examine projected market growth, continued adoption, and the difficulties organizers encounter when delivering online experiences.
- 59%: Event professionals who say virtual events are now a permanent fixture (Bizzabo).
- 93% of organizers plan to continue investing in virtual events (Gitnux).
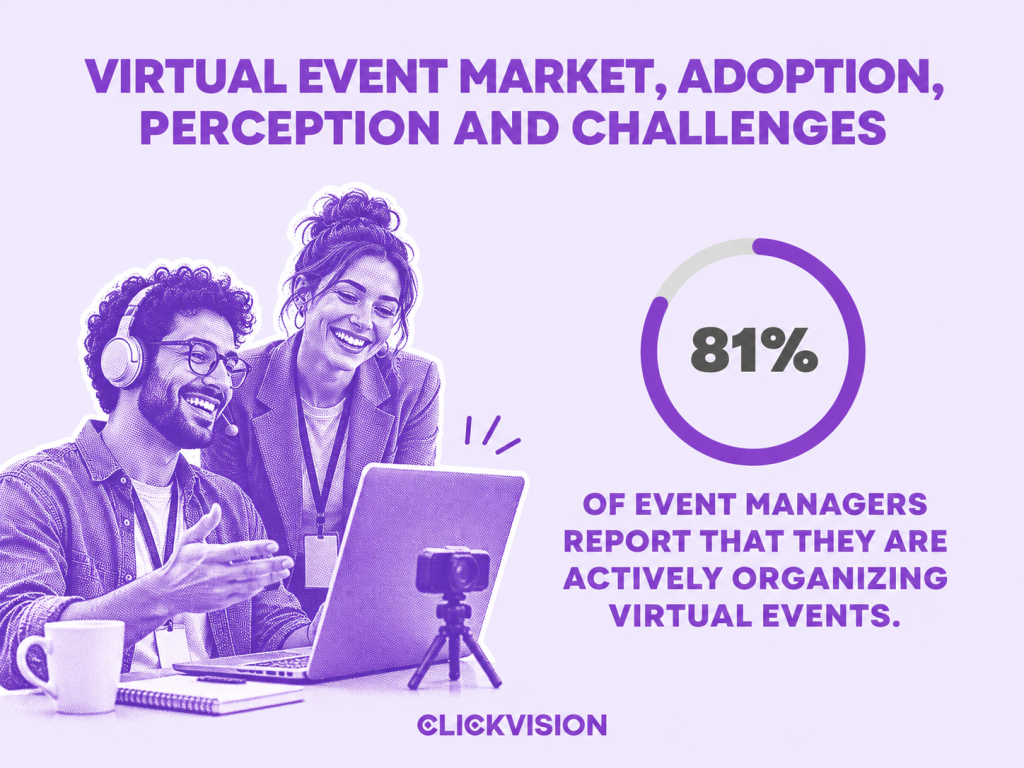
- Currently, 81% of event managers report that they are actively organizing virtual events. (Sweap)
- 93% of attendees feel companies have successfully transitioned from in-person to online events. (Kaltura)
- 52% of event pros say attendee engagement is the biggest challenge for virtual events (Gitnux).
Hybrid Event Adoption and Preference
Hybrid events combine physical attendance with online participation, allowing organizers to serve audiences through multiple formats. The following statistics examine how organizations perceive this approach and whether they intend to expand their hybrid event activities.
- 67% of organizations favor hybrid events. (Kaltura)
- Hybrid events are evolving: 63% of organizations plan to host more hybrid events for wider reach (Gitnux), and 67% of organizers believe hybrid is the future (99Firms). (Thunderbit)
Trade Show and Exhibition Statistics
Trade shows remain an established part of B2B marketing, bringing exhibitors, buyers, and industry professionals together. Their performance can be measured through market value, exhibition space, attendance, and business outcomes. These statistics examine the industry’s recovery and the challenges exhibitors face when converting event participation into sales.
CEIR Index and Trade Show Market Value
Trade show performance is often assessed through industry benchmarks that track exhibition space, exhibitors, and attendance. The following figures provide a view of the U.S. B2B exhibition market and its recent activity.
- The U.S. B2B trade show market hit $15.78 billion in 2024, finally exceeding pre-COVID levels (CEIR Index, 2024). (Vendelux)
- CEIR’s Q4 2024 trade show index hit 95.6, the highest reading since before COVID (CEIR, 2024). (Vendelux)
- Q4 2024 tracked 71 events that filled over 13 million net square feet of exhibit space, brought together 42,529 exhibitors, and drew 1,116,923 attendees (CEIR).
Post-Pandemic Recovery vs. 2019 Levels
The return of trade shows has not been uniform across every performance measure. Comparing recent results with 2019 helps reveal which areas have recovered and where attendance or exhibition activity still falls behind earlier levels.
- Q3 2025 showed sluggish growth: exhibit space up 0.8%, exhibitors up 0.6%, attendance down 2.1% year-over-year (CEIR Q3 2025 Index via Exhibitor Online).
- By Q3 2025, exhibitor count was only 5% below the 2019 benchmark, but net square feet was 8.3% below and attendance was 12.3% short of pre-COVID levels (CEIR Q3 2025 Index via Exhibitor Online).
Exhibitor Budgets and Trade Show Lead Follow-Up
Exhibiting at trade shows requires financial investment, but the results depend heavily on what happens after the event. These statistics examine spending patterns, lead conversion confidence, and the importance of timely follow-up.
- 74% of Fortune 1000 exhibitors increased event budgets, yet only 6% feel confident converting leads.(Momencio)
- 80% of trade show leads never receive any follow-up. (NeverDrop)
- Conversion likelihood drops sharply when follow-up occurs after 24–48 hours.
Experiential Marketing Statistics
Experiential marketing focuses on creating direct interactions between brands and their audiences. These activities can include brand activations, immersive experiences, and interactive events. The following statistics examine how B2B marketers allocate budgets, evaluate their programs, and manage the challenges of delivering memorable experiences.
Experiential Budget Allocation and Spending Priorities
Experiential marketing competes with other channels for a share of marketing budgets. These figures show how much B2B marketers allocate to experiential activities and whether organizations plan to increase their spending.
- Forty percent of B2B marketers allocate just 1–10% of total spend to experiential; 26% allocate 11–30%; 13% budget 31–50%. Only 4% put more than half their marketing budget toward experiential, and 17% aren’t sure how much is budgeted at all. (Cvent)
- 33% of B2B marketers say events and experiential marketing rank in their top three areas for increased spending in 2026. (Cvent)
- 78% of B2B marketers report allocating budget to experiential marketing, but fewer than 1 in 3 (30%) rate their efforts as established, advanced, or leading. (Cvent)
Experiential Program Maturity and Measurement
Investment alone does not indicate how developed an experiential marketing program is. Businesses also need established processes for planning, execution, and measurement. These statistics examine program maturity and the methods marketers use to evaluate results.
- The majority of B2B experiential programs are still in early stages. Thirty-five percent describe their efforts as exploratory, and another 35% as developing. (Cvent)
- B2B marketers most commonly measure experiential impact through event engagement metrics like attendance and participation (70%), followed by customer feedback such as NPS and surveys (46%), revenue-based ROI (46%), content performance (39%), and brand awareness or sentiment (34%). (Cvent)
Experiential Marketing Challenges
Delivering experiential campaigns can be demanding, particularly when resources and budgets are limited. The following findings identify the operational, financial, and organizational challenges that marketers most frequently report.
59%
of marketers cite insufficient team resources as their biggest experiential marketing challenge
33%
of marketers say a lack of budget hampers their use of experiential marketing
67%
of respondents consider sustainability a real constraint due to environmental concerns
19%
of marketers face difficulties due to a lack of global team alignment
11%
of marketers report challenges due to a lack of technology to support their strategy
Source: Cvent
Event Marketing Budget and Spending Statistics
Event marketing budgets reflect both the value businesses place on events and the financial pressures facing organizers. While some companies plan to increase investment, others are working within tighter limits. These statistics examine spending expectations, budget allocation, sponsorship strategies, and rising event costs.
Event Budget Outlook and Recent Budget Trends
Event spending expectations vary across organizations and industries. Some businesses anticipate larger budgets, while others plan to maintain existing investment levels. The following statistics compare recent budget trends with expectations for 2026.
| Budget trend for 2026 | Share of organizers |
|---|---|
| Budgets increasing | 40% |
| Budgets staying flat | 40% |
| Budgets shrinking | 20% |
Source: Bizzabo
- 67% of event professionals expect an increase in overall meeting spend in 2026, with 13% predicting an increase of more than 10%. American Express
- 83% of B2B marketing decision-makers expect marketing investments to grow in 2026. Of those, 40% expect 5%+ growth and 44% expect 1-4% growth (Forrester).
- 69% of B2B events leaders saw event budgets stay flat or decrease in 2025. 38% reported flat budgets year-over-year (Marketing Week).
Marketing Budget Benchmarks and Event Spend Allocation
Understanding event spending requires looking at the broader marketing budget. These figures examine how businesses distribute their resources across marketing activities and how much funding events and trade shows receive.
- Median B2B marketing budget sits at 9.1% of company revenue in 2026 per the Gartner CMO Spend Survey. Software companies average 11.4%, professional services 8.9%, manufacturing 5.7% (Gartner, 2026). (Vendelux)
- Events and trade shows claim approximately 17% of B2B marketing budgets, having returned to pre-COVID levels (Forrester).
- Marketing Programs receive the largest share of B2B marketing budget at 42%, followed by Personnel at 35% and Technology at 23% (Forrester).
- 48% of marketers dedicate at least 21% of their marketing budget to in-person events. (Thunderbit)
- Marketing and promotion are now the top spending categories, followed by venue and catering (Bizzabo).
Event Sponsorship and Owned-Event Strategy
Organizations can reach their audiences by sponsoring external events or hosting their own. Each approach involves different costs, responsibilities, and opportunities. These statistics examine how companies are balancing sponsorships with owned-event strategies.
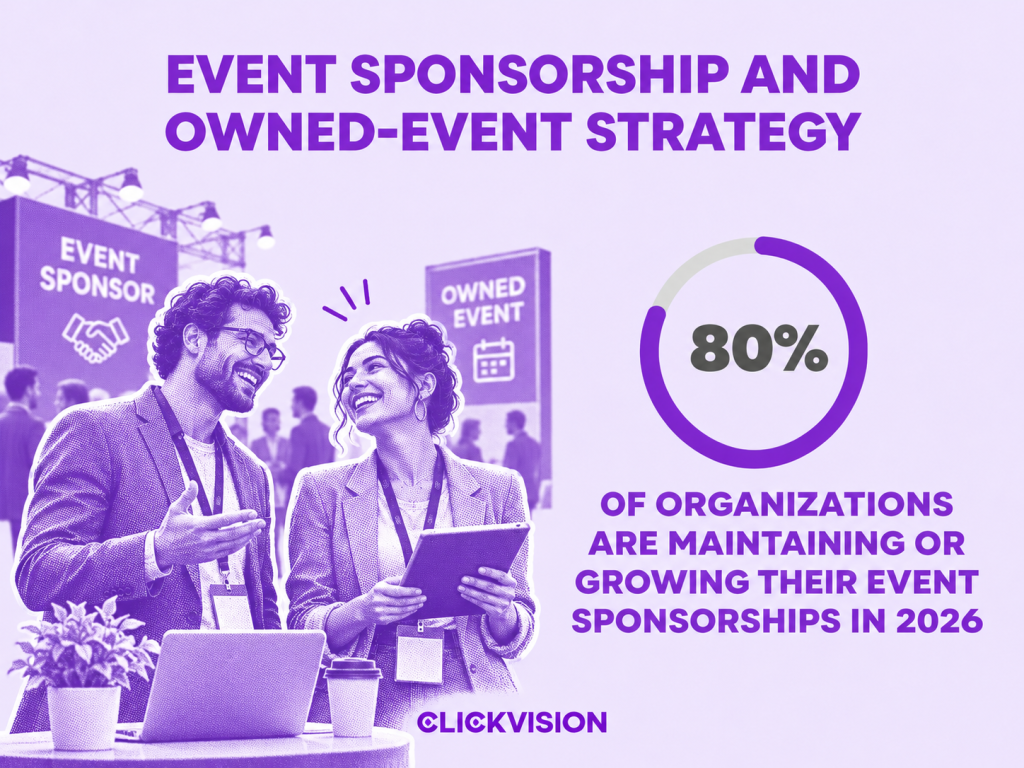
- 80% of organizations are maintaining or growing their event sponsorships in 2026 (Vendelux 2026 B2B Events Survey).
- 53% of organizations prefer hosting their own events versus 47% prioritizing third-party event attendance, a shift driven by budget pressure and ROI accountability (Marketing Week).
Cost per Attendee and Inflation Pressures
Rising operating expenses can affect nearly every part of event planning, from venues to catering and staffing. The following figures examine cost pressures and how they influence event spending on a per-attendee basis.
- Corporate event spending is expected to increase in 2026, with the cost per attendee rising to $169 per day. (Kande)
- Inflation is affecting over 65% of event organizers, leading to increased costs across various event elements. (Momencio)
Event Ticket Pricing
Ticket pricing affects both event revenue and accessibility for potential attendees. Organizers must consider their costs, audience expectations, and event positioning when setting prices. These figures examine average ticket costs and planned pricing changes.
- Around 60% of event organizers plan to raise their ticket prices. (Momencio)
- The average ticket price was $41.90, with larger organizations charging closer to $59, while smaller organizations average $19 per ticket. (Momencio)
Event Technology and AI Statistics
Technology plays an increasingly important role in organizing, promoting, and measuring events. From registration platforms to AI-powered tools, organizers have more options for managing operations and improving attendee experiences. These statistics explore technology adoption, platform integration, spending, and the growing use of artificial intelligence.
Event Software Adoption and Perceived Impact
Event management platforms support tasks such as registration, scheduling, communication, and performance tracking. These statistics examine how widely organizers use such software and whether they believe it contributes to event success.
- The event management software market is projected to grow to $16.11 billion by 2026. (Fortune Business Insights)
- Over 85% of event planners now rely on event management software to streamline their operations. (G2)
- About 72.5% of event organizers believe that their event management platform played a critical role in the success of their most recent event. (G2)
- Over 65% of event planners say they will incorporate technologies like onsite check-in tools (53%), QR codes (49%), artificial intelligence (42%), and virtual reality (40%) in their upcoming events. (G2)
- 80% of organizers agree that event technology significantly impacts event success (Bizzabo).
Event Technology Stacks and Spend
Organizations often use several technology platforms to manage different aspects of their events. The following figures examine the complexity of these technology stacks and the amount businesses allocate to event-related software.
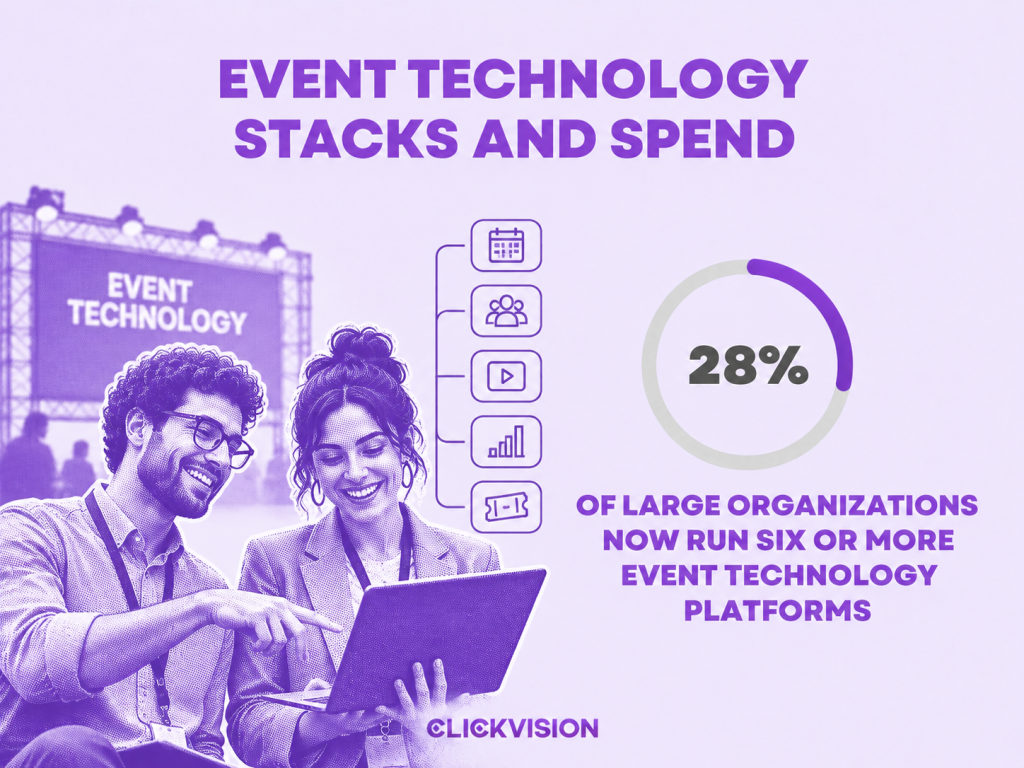
- 28% of large organizations now run six or more event technology platforms (Thunderbit).
- 24% spend 10,000–50,000/year on event tech; 21% spend 50,000–250,000 (Bizzabo).
CRM and Platform Integration
Connecting event platforms with customer relationship management systems helps teams track attendee interactions beyond the event. These statistics examine integration adoption and the challenges organizations face when linking event technology with their wider marketing systems.
- 79% of organizers have wired their event platform into their CRM or marketing automation stack—and 64% intend to switch event management software vendors within the year (Bizzabo).
- Integration is still a hurdle: Only about 20% of enterprises have fully integrated their event tech with their broader marketing stack (ExpoPlatform).
- Integrated CRM-driven exhibitors achieve roughly 2–3× higher conversion outcomes. (Momencio)
Event Mobile App and Attendee Technology Expectations
Technology also influences how attendees navigate and participate in events. Mobile apps, digital schedules, and other tools have become part of the conference experience. These figures examine attendee expectations and the importance of convenient digital features.
- 73% expect modern event technology at in-person conferences, up from 63% in 2023 (Bizzabo).
- 68% of attendees say having a mobile event app is a must (Bizzabo).
- 65% of attendees say the mobile event app can make or break their experience, up from 56% in 2023 (Bizzabo).
AI in Event Marketing
Artificial intelligence is becoming part of event planning and technology development. Organizers are exploring applications ranging from content creation to attendee matchmaking. Beyond these applications, AI can also support lead qualification and follow-up, making AI lead generation statistics relevant to marketers evaluating how automation fits into their wider event strategy. The following statistics highlight current AI capabilities and expectations for future adoption.
61%
of event tech companies offer at least one AI-powered feature
95%
of organizers expect their use of AI at events to increase
14.8%
of event tech companies offer AI chatbots
Source: Bizzabo
- 35% plan to deploy AI matchmaking for attendees and sponsors, 50% plan to use AI for creative and agenda building, and 40% plan AI-driven event apps (Thunderbit).
B2B Event Marketing and Buying Behavior Statistics
B2B purchasing decisions frequently involve multiple stakeholders and lengthy evaluation processes. Events provide opportunities to connect with buyers during those journeys, but success requires coordination between marketing and sales. These statistics examine buying behavior, sales cycle length, and how organizations integrate events into their revenue strategies.
B2B Buying Committee Size and Composition
Business purchases rarely depend on a single decision-maker, especially for complex products and services. These figures examine the number of stakeholders involved in B2B transactions and the role different departments play in purchasing decisions.
- The average B2B purchase now involves 13 stakeholders, and 89% of buying decisions cross multiple departments (Forrester State of Business Buying 2024). (Vendelux)
- Gartner’s 2025 research puts the average B2B buying committee at 9 to 11 stakeholders, up from 5 to 7 in 2017 (Gartner via Attainment)
- 53% of B2B buying groups have at least one C-suite executive involved in the decision (Forrester via Attainment, 2025). (Vendelux)
B2B Sales Cycle Length and Buyer Journey
B2B buyers often spend considerable time researching options before speaking directly with vendors. These statistics examine sales cycle duration, purchasing preferences, and how much of the buying process happens without direct sales involvement.
- The average B2B sales cycle has expanded to 6.5 months in 2025, up from 4.9 months in 2019 (B2B Sales Benchmarks 2025).
- Deals under $25K ACV average roughly 90 days, while deals over $100K regularly run 6-9+ months (B2B Sales Benchmarks 2025).
- B2B buyers spend only 17% of their total buying time in direct contact with potential vendors; roughly 80% of the buying journey now happens without direct salesperson involvement (Gartner B2B Buying Journey).
- 61% of B2B buyers prefer an overall rep-free buying experience (Gartner B2B Buying Journey).
Sales Alignment, GTM Integration and Event Ownership
Event performance often depends on how closely marketing and sales teams work together. These findings examine the ownership of event programs, their integration into go-to-market strategies, and the level of alignment between departments.
- Vendelux’s GTM Integration Score for events is 3.44 out of 5. Only 14% of teams reported full integration into revenue planning (Vendelux 2026 B2B Events Survey).
- 59% of B2B organizations have events owned by Marketing (CMO, Field, or Events functions). Only 10% have events owned by Revenue leadership (Vendelux 2026 B2B Events Survey).
- The Sales Alignment Score for events is 3.73 out of 5. Teams generally agree on which events matter; they struggle to execute and report on them together (Vendelux 2026 B2B Events Survey).
- 52% of B2B event teams added headcount in 2024 (Bizzabo).
Event Sustainability, Diversity and Inclusion Statistics
Environmental responsibility, accessibility, and inclusion are increasingly discussed in event planning. However, organizational policies and attendee priorities do not always align. The following statistics examine sustainability practices, emissions tracking, and attitudes toward corporate social responsibility and inclusive events.
Sustainability Policies and Carbon Practices
Event organizers can reduce environmental impact through changes in travel, materials, waste management, and operational planning. These statistics examine how organizations are introducing sustainability policies and measuring their environmental performance.
- 38%: Organizations with a formal sustainable meetings policy; only 25% track CO2e (Thunderbit).
- 50% of event hosts now include a carbon offset option in registration (Gitnux).
- More than 50% of companies are reducing their event emissions by minimizing waste and focusing on recyclable materials. (G2)
Attendee and Workforce Attitudes Toward Sustainability, DEI and CSR
Attendees and event professionals may place different levels of importance on sustainability, inclusion, and corporate social responsibility. These figures explore how such considerations influence event preferences and organizational priorities.
- Lowest-ranked priority: Inclusivity, accessibility and sustainability score bottom of B2B event teams’ priority lists (Thunderbit).
- 90% of Gen Z professionals prefer companies that demonstrate strong CSR at events (Gitnux). (Thunderbit)
- Only 18% of attendees said sustainable practices were their top priority when deciding to attend (Bizzabo).
- Roughly 26.8% of attendees say that sustainability and diversity, equity, and inclusion (DEI) are their top priorities when choosing an event to attend. (G2)
Conclusion
Looking across the data, the event marketing statistics tell a consistent story. Events remain one of the most trusted ways to build relationships and move deals forward. Yet proving their value is still the hardest part for most teams. The numbers also show that attendees want meaningful, well-planned experiences, whatever format you choose.
At the end of the day, data is only useful when you read it carefully. Each figure reflects a specific survey, audience, and time period. By understanding that context, you can borrow the insights that fit your goals and build a stronger case for your next event.