
Most of us have hit send on a cold email and waited for a reply that never came. It stings a little, and it makes you wonder if the problem is your message or the channel itself. Cold email marketing statistics offer a more honest answer than guesswork ever could. Averages hover around a few percent, yet some campaigns pull far ahead of that.
So what separates the campaigns that land meetings from the ones that vanish? In this article, we’ll look at the latest benchmarks for reply rates, subject lines, follow-ups, timing, and deliverability. You’ll see where the real gains hide, and where popular advice falls flat. Think of it as a clear map for your next campaign.
Cold Email Reply Rate Statistics
Reply rates are one of the most useful ways to measure cold email performance, but they don’t tell the whole story. Results vary depending on the audience, campaign purpose, and how responses are counted. Some studies measure replies across entire sequences, while others calculate them against individual emails sent.
Overall Success and Failure Rates
Getting someone to respond to an unsolicited email is difficult, even when the message reaches the right person. Most cold emails receive no response, making it important to understand how often outreach fails before setting campaign expectations.
- About 95% of cold emails fail to generate a reply, and average response rates are 1% to 5%. (GMass)
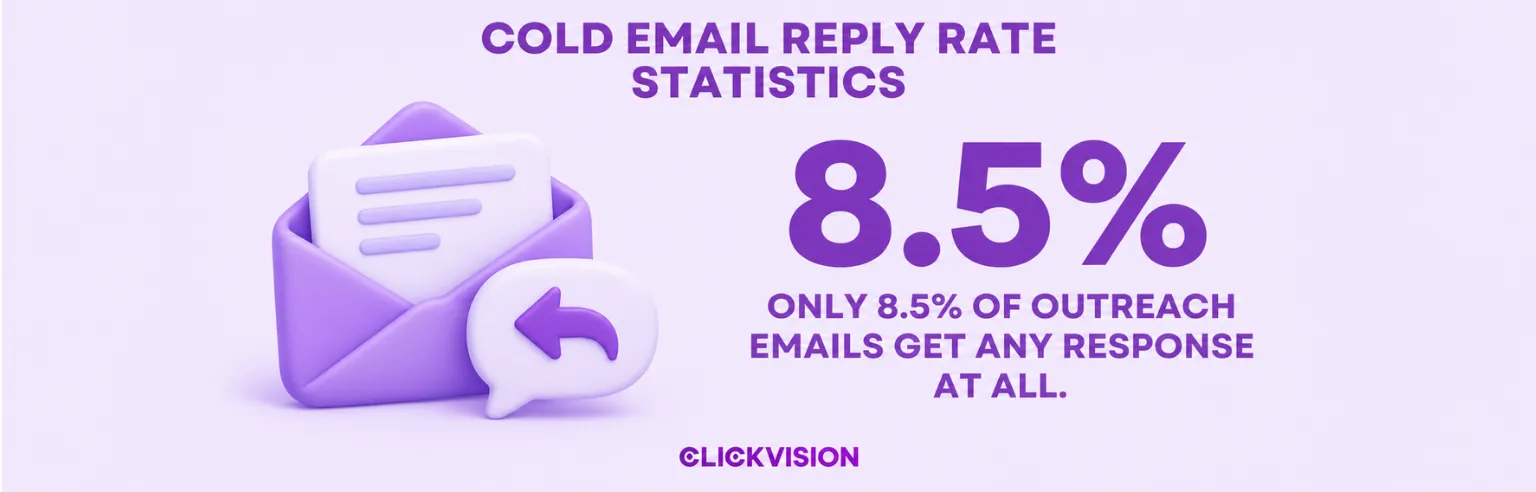
- Only 8.5% of outreach emails get any response at all. (GrowthList)
Average Cold Email Reply Rates
The average cold email reply rate differs considerably between studies. These differences often reflect the audiences, campaign samples, and calculation methods used. Comparing benchmarks is useful, but only when the underlying measurement is clear.
- Hunter’s analysis of 31 million emails sent in 2025 puts the average sequence reply rate at 4.5%, and a rate of 3% to 5% is a healthy benchmark. (Hunter)
Top-Performing Campaign Reply Rates
Average performance provides a starting point, but the strongest campaigns achieve considerably higher engagement. Looking at top-performing campaigns helps illustrate how far results can improve beyond typical industry benchmarks.
- Tier 1 (top 10%): 10.7%+ reply rate. (Instantly)
- Tier 2 (top 25%, or top quartile): 5.5%+ reply rate. (Instantly)
15% to 30%
reply rates
Top 1% campaigns
11% to 15%
reply rates
Top 5% campaigns
3% to 10%
reply rates
Average campaigns
Source: Saleshandy
Reply Rates by Campaign Type
Not all cold emails serve the same purpose. Sales prospecting, recruitment, marketing, and digital PR involve different audiences and motivations, which can lead to substantial differences in response rates.
| Campaign type | Reply rate |
| Sales outreach | 3% |
| Marketing | 6.2% |
| Headhunting | 7.5% |
| Digital PR outreach | 13% |
Source: Hunter
Interested (Positive) Replies
A response doesn’t necessarily mean the recipient is interested. Some replies are objections, referrals, or requests to stop contacting someone. Positive reply rates provide a more meaningful indication of whether a campaign is reaching potential customers.
- In the strongest campaigns, 25% to 50% of all replies were classified as interested. (Saleshandy)
Cold Email Open Rate Statistics
Open rates indicate how frequently recipients appear to open outreach messages, although tracking technology makes them less reliable than they once were. Email privacy protections and image-loading behavior can distort the numbers. For that reason, open rates are best considered alongside replies and other measurable outcomes.
Average Open Rates
Cold email open rates vary between platforms and sending environments. While they can provide a general indication of initial engagement, a recorded open doesn’t guarantee that someone actually read the message.
- The average cold email open rate is 21%, or roughly 1 in 5 emails. (Saleshandy)
- The average open rate on Hunter sequences was 30%, which Hunter attributes partly to Gmail and Outlook tightening their spam filters (Hunter)
- The platform-wide average is 27.7%. (Woodpecker)
Open Tracking and Reply Rates
Tracking pixels allow senders to estimate opens, but they can also introduce deliverability and measurement complications. Several studies have compared campaigns with and without open tracking to examine whether the feature affects response rates.
- Sequences with open tracking off replied at 7.4%, compared with 4.4% with tracking on (Hunter)
- Across more than 44 million emails, turning off open tracking more than doubled reply rates, from 1.08% to 2.36% (Snov.io)
Cold Email Conversion and Meeting Statistics
Replies are only one stage of the cold email process. For sales teams, the larger objective is turning outreach into qualified conversations, booked meetings, and eventually customers. Conversion statistics help establish how much activity is typically needed to produce measurable business results.
Click-Through and Conversion Rates
Click-through rates measure interaction with links, while conversion rates depend on the action being tracked. That might mean scheduling a meeting, completing a form, or closing a sale. When an email directs recipients to a website, the landing page experience can also affect whether those clicks turn into conversions. These outcomes shouldn’t be treated as interchangeable when comparing campaigns.
- The average click-through rate for cold emails is 3% to 4%. (Infraforge)
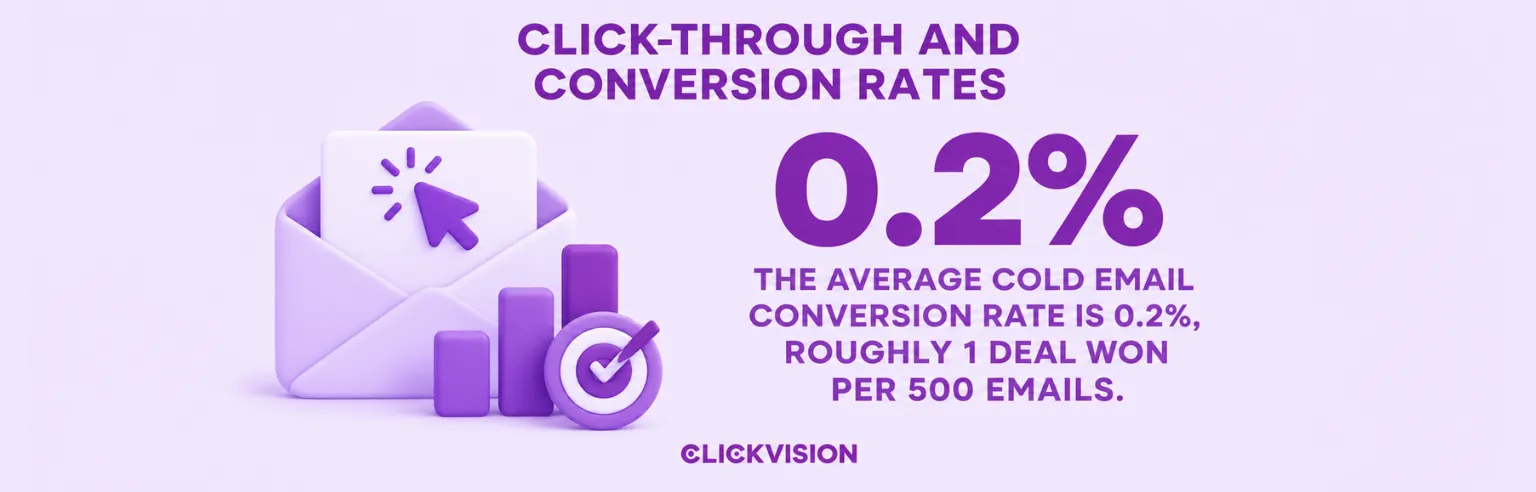
- The average cold email conversion rate is 0.2%, roughly 1 deal won per 500 emails. (Focus Digital)
- Cold outreach conversion typically ranges from 0.2% to 2% (Infraforge), 2% is solid in B2B, and 5% is exceptional. (Martal)
Meetings Booked and Rep Performance
Meeting-booking statistics offer a more direct measure of sales outreach effectiveness. They also reveal substantial differences between average representatives and top performers, even when both groups use the same communication channel.
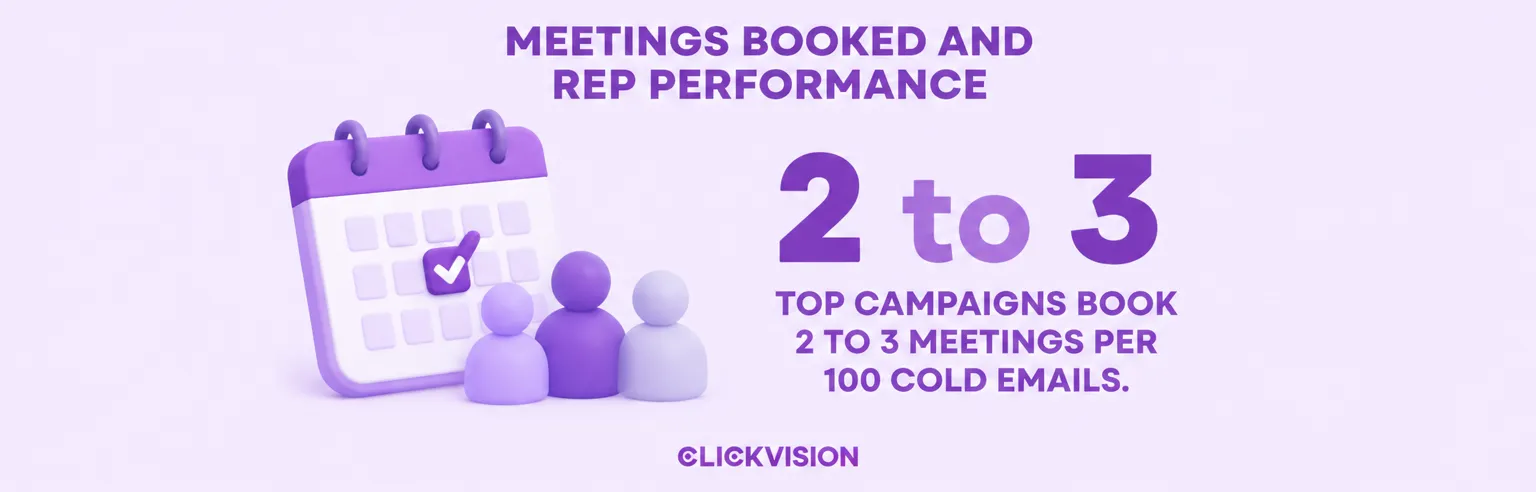
- Top campaigns book 2 to 3 meetings per 100 cold emails. (Saleshandy)
- Belkins booked more than 1,200 appointments from 7.5 million cold emails sent in 2025 (Belkins)
- The average rep sends 344 cold emails to land one meeting. (Gong)
- Top reps get 4.2 times the replies of average reps and book 8.1 times the meetings. (Gong)
Cold Email Subject Line Statistics
The subject line is often the first part of a cold email that recipients notice. Its length, wording, and relevance can influence whether a message attracts attention. However, subject line performance should be evaluated using replies and meaningful engagement, not open rates alone.
Subject Line Length
Long subject lines can become difficult to scan, particularly on mobile devices, while extremely short ones may lack context. Research into word and character counts helps identify the lengths associated with stronger engagement.
- Subject lines with 5 to 7 words (36 to 50 characters) had the highest open rates. (Saleshandy)
- Subject lines of 36 to 50 characters get 24.6% higher response rates than shorter or longer ones. (MailMend)
- Five to six words is the sweet spot for average reply rates. (Hunter)
Subject Line Content and Personalization
Length isn’t the only factor affecting subject line performance. Personalization, company references, questions, and commonly used phrases can all influence results. The following findings show how different approaches compare.
- Subject lines with two custom attributes averaged a 40.2% open rate, compared with 35.4% for subject lines with one. (Hunter)
- Using the company name in the subject line can boost opens by about 22%. (SmartLead)
- A question in the subject line lifts open rates by about 21%. (SmartLead)
- “Quick question” subject lines underperformed, at a 2.5% reply rate and 28.7% open rate, compared with 2.9% and 32.9% for other subject lines. (Hunter)
- 35% of recipients open emails based on the subject line alone. (Propeller CRM)
Cold Email Length, Copy and Call-to-Action Statistics
The body of a cold email determines whether initial attention turns into a response. Message length, language, and the requested next step all influence engagement. Research suggests that effective outreach generally prioritizes relevance and clarity over detailed product explanations.
Email Length
A cold email needs enough information to establish relevance without demanding too much attention. Studies have examined how word counts and sentence lengths relate to replies, although their findings don’t always point to one ideal length.
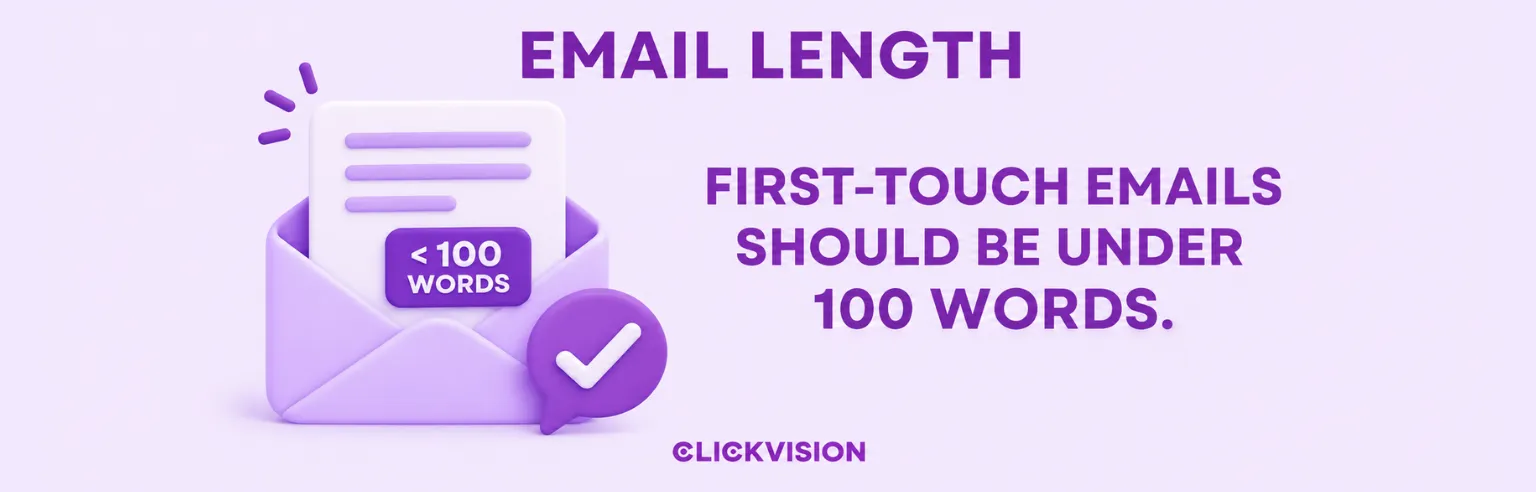
- First-touch emails should be under 100 words. (Saleshandy)
- Elite senders keep first-touch emails under 80 words. (Instantly)
- The highest reply rates come at 100 words or fewer and 3 to 4 sentences. (Gong)
- Emails of 61 to 80 words and of 181 to 200 words both got comparatively high reply rates. (Hunter)
- 50 to 125 words now achieves the highest reply rates in 2025 to 2026 data, roughly 50% higher than longer formats. (Mailforge)
Wording and Messaging
Small wording choices can influence how recipients perceive an email. Phrases that seem persuasive to the sender may come across as overly promotional, while conversational language can produce different results for replies and booked meetings. In B2B content writing, understanding the audience’s business needs is equally important, since even a well-written message can fail when it addresses the wrong priorities.
- Mentioning your call or voicemail in an email does not lead to more meetings booked. (Gong)
- Buzzwords and numbers in the email reduce open rates by up to 17.9%. (Gong)
- Emails without links, images or attachments earned a 1.30% reply rate, against 1.08% for emails with them. (Snov.io)
- Spintax made little difference, 1.09% with it and 1.28% without. (Snov.io)
| Email approach | Reported finding |
| Product-focused pitches | Up to 57% fewer replies |
| ROI-focused language | 15% lower success rates |
| Using “thoughts” | 20% fewer meetings booked |
| Opening with “Hope all is well” | 24% more meetings booked |
Source: Gong
Calls to Action
The call to action determines what recipients are being asked to do next. A request for a meeting requires more commitment than a simple expression of interest. Comparing these approaches helps explain why the type and number of CTAs matter.
- Emails with a single soft CTA get 78% more positive replies than emails with hard CTAs, and emails with multiple CTAs performed worst. (Saleshandy)
- The Interest CTA (for example, “Are you interested in learning more about X?”) is the highest-performing call to action for cold emails. (Gong)
Cold Email Personalization Statistics
Personalization goes beyond adding someone’s first name to a template. It can involve referencing their company, professional responsibilities, or specific business challenges. Research examines how much personalization improves engagement and whether adding more details continues to produce better results.
Personalization and Reply Rates
Personalized outreach generally performs better than generic messaging, but the relationship isn’t necessarily linear. Adding a few relevant details can improve responses, while excessive customization may provide diminishing returns.
- Reply rates climb from 3.6% with no personalization to 5.6% with two attributes, then flatten and dip at five or more. (Hunter)
- Advanced personalization (custom snippets beyond first name or company name) averages a reply rate of about 17% to 18%. (Woodpecker)
- Basic or no personalization averages about 7% to 9%. (Woodpecker)
- Highly personalized campaigns boost replies by 142% versus non-personalized blasts. (Martal)
- Only 5% of senders personalize every email, and those who do see 2 to 3 times better results (Mailshake)
7–9%
Average reply rate with basic or
no personalization
Basic Personalization
17–18%
Average reply rate using custom snippets beyond names and company details
Advanced Personalization
Source: Woodpecker
Recipient Attitudes Toward Personalization
Performance data shows what recipients do, while surveys help explain their preferences. These findings examine whether people value personalized messages and which forms of customization make them more willing to respond.
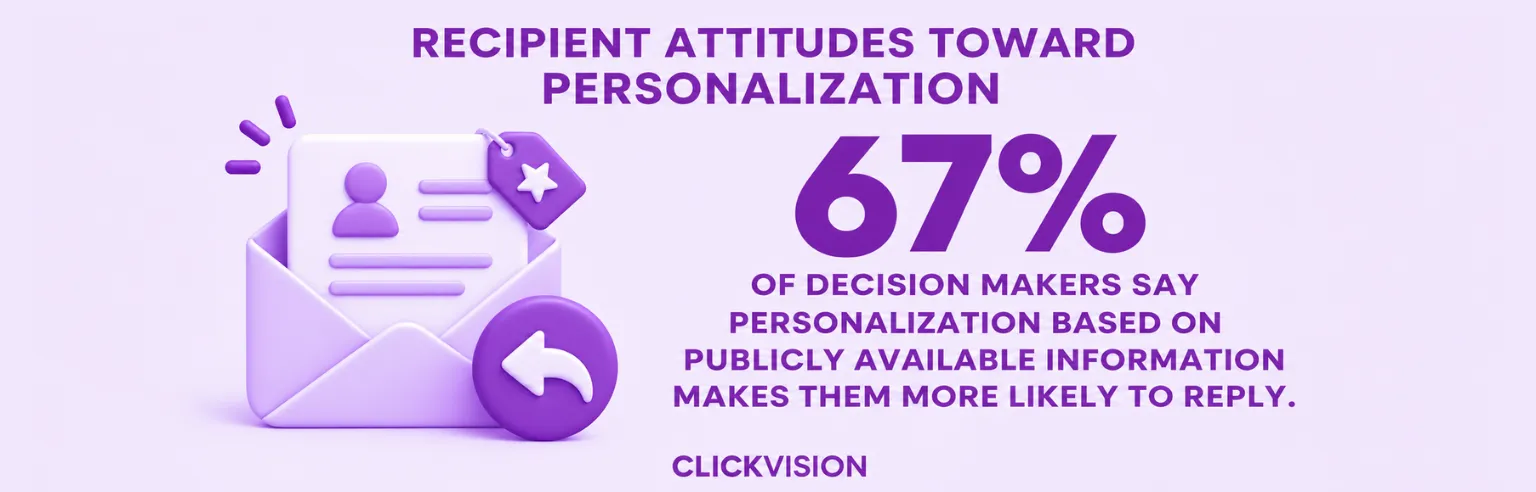
- 67% of decision makers say personalization based on publicly available information makes them more likely to reply. (Hunter)
- 36% of consumers said a longer, personalized email containing their name would make them most likely to respond. (EmailToolTester)
- A long, non-personalized email was the format least likely to elicit a response. (EmailToolTester)
- 15.1% of people said they wouldn’t respond to any of the cold email formats offered. (EmailToolTester)
Cold Email Follow-Up Statistics
A single email often isn’t enough to generate a response. Follow-ups create additional opportunities to reach recipients who missed, postponed, or overlooked the original message. However, sending more emails doesn’t automatically mean better results, especially when later messages add little value.
Share of Replies From Follow-Ups
Follow-up messages account for a substantial portion of campaign responses, although their contribution varies between studies. Understanding where replies originate helps determine whether a sequence should continue beyond its initial message.
- 58% of all replies come from step one, and the remaining follow-ups contribute 42%. (Instantly)
- Follow-up emails produced 58.6% of all replies in Belkins’ 2025 sequences. (Belkins)
- 57% of all replies came from follow-ups. (Corrected from “positive replies” in the audit; the step table below sums to 56.6%.) (Saleshandy)
Reply Rates by Sequence Step
Engagement typically changes as an outreach sequence progresses. The first message reaches the full initial audience, while subsequent emails target people who haven’t responded or otherwise exited the sequence. This makes both the reply rate and the share of total replies useful measures.
- Belkins’ first email replied at 0.59% and the sixth at 0.28%. (Belkins)
- The fourth email out-replied the third, 0.34% to 0.30%. (Belkins)
| Follow-up | Emails sent | Reply rate |
| First follow-up | 7.49M | 0.80% |
| Second follow-up | 5.60M | 0.57% |
| Third follow-up | 2.75M | 0.56% |
| Fourth follow-up | 1.31M | 0.46% |
| Fifth and later | 1.19M | 0.37% |
Source: Saleshandy
Follow-Up Impact on Total Replies
Looking at individual follow-up rates doesn’t reveal their full contribution. A sequence can generate more total responses than a single email because it creates several opportunities for recipients to engage.
- Using three messages instead of one lifted total replies by 106%, from 3.3% to 6.8%. (Hunter)
- Replies continue beyond step 10, though at much lower rates. (Instantly)
Follow-Ups and Booked Meetings
The sequence step that generates the most replies isn’t necessarily the one that produces the most meetings. Some recipients need additional contact before agreeing to a conversation, making meeting-booking data especially useful for evaluating follow-up strategies.
- Step three booked more appointments than steps one and two combined. (Belkins)
- Steps three to five produced 53.5% of all email-sourced meetings. (Belkins)
- From step three onward, the appointment rate held at 0.2%, twice the rate of the first two steps. (Belkins)
Number of Follow-Ups and Sequence Length
The ideal sequence balances additional opportunities for engagement against declining returns. Research suggests that several follow-ups can be worthwhile, but continuing indefinitely is unlikely to produce proportional improvements.
- The sweet spot for sequence length is 4 to 7 touchpoints. (Instantly)
- Most successful sequences had 4 to 6 follow-ups over 20 to 21 days. (Saleshandy)
- lemlist recommends 4 to 9 follow-ups and finds the benefit negligible after 9 or more. (lemlist)
Follow-Up Timing
How frequently messages arrive can affect the recipient’s experience. Closely spaced follow-ups may feel intrusive, while long gaps can make the conversation lose momentum. Recommended intervals also vary by audience and seniority.
- Touches should be spaced 3 to 4 days apart. (Instantly)
- Decision makers (VPs, C-suite) did best with 2 to 3 day intervals, and users and managers with 24 to 48 hour intervals. (Saleshandy)
Follow-Up Messaging
Follow-ups work best when they give recipients a reason to reconsider the original message. Their tone and wording matter, particularly when a campaign shifts from the initial introduction to reminders or additional context.
- A step 2 email written like a reply (“Quick follow-up on my note below, worth a look?”) outperforms formal follow-ups by about 30%. (Instantly)
- Using phrases like “I never heard back” increases reply rates but decreases meetings booked by 14%. (Gong)
Cold Email Timing Statistics
The day and time an email arrives can influence its chances of receiving attention. However, timing studies often produce different recommendations because audiences, industries, and regions behave differently. These benchmarks are most useful as starting points for testing rather than universal sending rules.
Best Days to Send Cold Emails
Weekday performance differs across outreach platforms, and the day with the highest reply rate may not generate the most meetings. Comparing these findings helps distinguish general engagement patterns from actual sales outcomes.
- Tuesday, Wednesday, and Thursday outperformed the rest of the week, and Monday mornings and Friday afternoons were lowest. (Saleshandy)
- Tuesday and Wednesday see peak reply rates, and Wednesday is the highest. (Instantly)
- Wednesday and Thursday led the working week at 0.48% each, Friday trailed at 0.44%, and Saturday fell to 0.35%. (Belkins)
- For booked meetings the order flips: Wednesday drops to a 0.1% meeting rate while the other days sit at 0.2%. (Belkins)
- Monday has the highest send volume across the platform and is the ideal day to launch sequences. (Instantly)
- Friday sees the highest volume of auto-replies, as prospects set out-of-office messages. (Instantly)
Best Times of Day to Send Cold Emails
Recipients’ schedules and time zones also influence outreach performance. Morning sends frequently perform well in reported datasets, but the strongest window can change across geographic markets and professional audiences.
- Tuesday between 9 and 10 AM in the prospect’s local timezone generated the highest reply rates. (Saleshandy)
- In the US and UK, sends between 8 and 10 AM local time performed best, and in APAC, afternoon sends beat morning sends. (Saleshandy)
- Sending in the prospect’s local timezone beat a single global schedule. (Saleshandy)
- Emails sent between 8 AM and noon had the highest reply rate, 0.54%. (Belkins)
- The afternoon window took the largest share of sends but replied at only 0.47%. (Belkins)
- Late-evening sends, the best slot in Belkins’ earlier studies, fell to 0.40% in 2025. (Belkins)
Cold Email Campaign Size and Targeting Statistics
Campaign size affects more than the number of people contacted. Larger lists can increase reach, but they may also reduce opportunities for careful targeting and customization. Research comparing smaller and larger campaigns helps show how audience selection relates to engagement.
- The average Hunter sequence in 2025 had 449 recipients, far above the size that performs best. (Hunter)
- 50 to 200 contacts: about 4% to 5%. (Woodpecker)
- Contacting one or two people per company produced a 5.1% reply rate, against 3.5% for three or more. (Hunter)
6.2%
reply rate
Sequences with 21–50 recipients
2.4%
reply rate
Sequences with 500+ recipients
Source: Hunter
Multichannel Cold Outreach Statistics
Cold email doesn’t have to operate independently of other prospecting channels. Sales teams also use phone calls, LinkedIn, and other touchpoints to reach potential customers. Multichannel statistics help measure whether combining these methods improves responses and meeting bookings.
| Outreach channel | Positive reply rate |
| Email only | 0.11% |
| Email + LinkedIn | 0.21% |
| Email + Call | 0.28% |
| Email + LinkedIn + Custom Channel | 0.88% |
- Email + Call produces 2.5x the positive reply rate of email-only, and Email + LinkedIn produces 1.9x. (Saleshandy)
- Cold calls connected with 18.6% of prospects reached, against 5.04% for LinkedIn. (Belkins)
- LinkedIn follow-ups after a silent email sequence held reply rates above 7% in every month of 2025. (Belkins)
- Email produced 50% of Belkins’ 2025 meetings on volume, against 33.6% for calling. (Belkins)
- 50.5% of decision makers now prefer LinkedIn for outreach, against 25% for email. (Hunter)
AI and Automation in Cold Email Statistics
Artificial intelligence and automation are changing how sales teams research prospects, write messages, and manage outreach sequences. Within the broader field of AI lead generation, cold email automation can help teams manage prospecting and outreach at scale. However, faster production doesn’t necessarily produce better communication. The statistics below compare automated approaches with human-edited messaging and examine how recipients perceive AI-generated emails.
- AI agents handle about 80% of research and sequencing work for elite teams. (Instantly)
- Manually edited emails got a 5.2% reply rate, 18% more than fully automated ones at 4.4%. (Hunter)
- 69% of US decision makers say it bothers them if AI was used to write an email. (Hunter)
- 61.4% of consumers think they can spot when a cold email has been AI-generated. (EmailToolTester)
- 44.4% would be less likely to engage with a cold email that had clearly been AI-generated. (EmailToolTester)
Cold Email List Quality and Verification Statistics
Even a well-written email cannot generate results if it’s sent to an invalid or unsuitable address. List verification helps identify addresses that may bounce or create delivery problems. The following data illustrates how frequently these risks appear and how address quality relates to bounce rates.
- Only 29.31% of addresses were safe to send, 21.77% were risky, 25.34% were not safe, and 23.58% were unknown. (Clearout)
- 36.8% of cold outreach addresses (18,054,840) were on free email providers, and 63.2% (~30,974,923) were on business or custom domains. (Clearout)
- 7.71% of addresses were on catch-all domains, which can soft bounce and inflate perceived deliverability. (Clearout)
- Valid addresses had a 1.21% bounce rate, unverified 2.11%, risky 2.22%, and bad 10.58%. (Saleshandy)
- Verified addresses had approximately 43% lower bounce rates than unverified ones. (Saleshandy)
| Email address status | Bounce rate |
| Valid | 1.21% |
| Unverified | 2.11% |
| Risky | 2.22% |
| Bad | 10.58% |
Source: Saleshandy
Cold Email Deliverability and Bounce Rate Statistics
Before a recipient can consider an email, the message must reach a usable destination. Deliverability depends on factors such as address validity, sender authentication, domain reputation, and filtering systems. Bounce rates provide one measure of sending quality, but they don’t confirm that a message reached the inbox.
Bounce Rates and Inbox Placement
A low bounce rate indicates that most messages weren’t rejected during delivery, but some accepted emails may still land in spam folders. This distinction matters when interpreting deliverability claims and comparing campaign performance.
- 17% of cold emails never reach any inbox, lost to bounces or spam filtering (Infraforge). Elsewhere the article says 16.9%, or about one in six. (Martal)
- Belkins’ 2025 bounce rate was 1.71%, an implied deliverability rate of 98.29% (deliverability rate is calculated by subtracting bounces, not by measuring actual inbox placement). (Belkins)
- May was the worst month for bounces at 2.26% and October the best at 1.26%. (Belkins)
- India had the highest bounce rate of any major market at 3.26%, and Finland the lowest at 0.71%. (Belkins)
- Hunter users averaged a 3.6% bounce rate and a 1.6% unsubscribe rate. (Hunter)
- Custom SMTP and Azure setups (“Others”) had the lowest bounce rate at 1.80%. (Saleshandy)
- Bounce rates should stay below 2%. (Instantly)
Unsubscribe Rates
Unsubscribes provide another indication of how recipients react to outreach. Rates can vary between industries and audiences, making them useful for monitoring whether a campaign’s targeting and frequency are appropriate.
- Belkins’ unsubscribe rate was 0.36% per email sent. (Belkins)
- Advertising and marketing recipients unsubscribed most, at 0.70%, against 0.15% in insurance. (Belkins)
Sending Setup and Infrastructure
Sending infrastructure can influence how email providers handle outgoing messages. Domain choice, email provider, sending method, and daily volume are among the factors examined in cold outreach benchmarks.
- A custom domain replied at 5.2%, against 2.5% from freemail addresses. (Hunter)
- Google Workspace replied at 5.9%, against just over 4% for Microsoft 365. (Hunter)
- The Gmail API replied at 3.45%, against 1.66% over SMTP. (BlazeHive)
- Sending 20 to 49 emails per day per account produced a 5.7% reply rate, 27% above the overall average. (Hunter)
- Teams that keep domain health stable and send consistently see 15% to 20% higher replies. (Instantly)
Gmail, Yahoo and Outlook Sender Requirement Statistics
Major mailbox providers have established technical requirements designed to reduce spam and improve email authentication. These policies affect how businesses configure sending domains, process unsubscribe requests, and monitor complaints. Understanding the rules is necessary for maintaining compliant, reliable outreach infrastructure.
- Gmail tells senders to keep their user-reported spam rate below 0.1% and never let it reach 0.3%. (Google)
- A bulk sender is anyone sending close to 5,000 messages or more to personal Gmail accounts in 24 hours, counted across the whole primary domain. (Google)
- Since February 2024, senders above 5,000 messages a day must publish DMARC, which can be set to p=none. (Google)
- Bulk senders above a 0.3% spam rate lose access to delivery mitigation until they stay below it for 7 consecutive days. (Google)
- Google set a two-day deadline for large senders to process unsubscribe requests. (Google)
- Yahoo requires bulk senders to keep spam complaints below 0.3% and to honor unsubscribes within 2 days. (Yahoo)
- Yahoo asks senders to sign every email with DKIM using a key of at least 1024 bits. (Yahoo)
- Since May 5, 2025, Outlook requires SPF, DKIM and DMARC from domains sending more than 5,000 emails a day. (Microsoft)
- Non-compliant Outlook mail is rejected with the code 550 5.7.515, and an SPF record that exceeds 10 DNS lookups may fail its check. (Microsoft)
- Gmail tightened enforcement in November 2025, so non-compliant senders face temporary or permanent rejection. (Martal)
Cold Email Statistics by Industry, Job Title, Company Size and Region
Cold email results depend heavily on who receives the message. Different industries, professional roles, company sizes, and geographic markets can respond at different rates. Segmenting benchmarks by audience provides more useful comparisons than relying on one overall average.
Industry
Industry-specific reply rates reveal differences in how organizations engage with unsolicited outreach. However, rankings can vary between datasets because campaign purposes, targeting methods, and sample sizes aren’t necessarily the same.
- SaaS had the highest reply rates, followed by Information Services and eCommerce. (Saleshandy)
- Financial Services and Real Estate had the lowest engagement. (Saleshandy)
- Food and beverage companies replied at 3.47%, nearly eight times the overall average, among industries with at least 20,000 emails sent. (Belkins)
Job Title and Company Size
Decision-making responsibilities change with organizational size. A founder at a small business may handle purchasing decisions directly, while larger companies distribute responsibility across management and executive roles. These differences can influence which contacts respond to outreach.
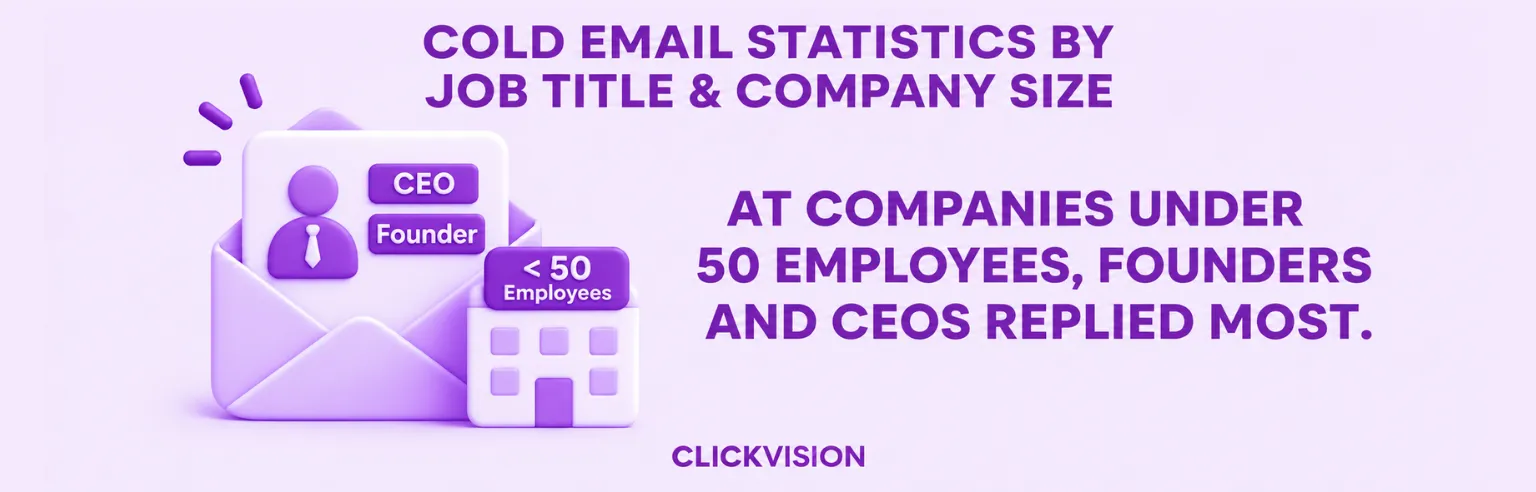
- At companies under 50 employees, Founders and CEOs replied most. (Saleshandy)
- At companies of 50 to 500 employees, Managers and Directors replied most. (Saleshandy)
- At companies of 500+ employees, C-level executives replied most. (Saleshandy)
- Founders and owners replied at 0.57%, 35% more often than C-level executives at 0.42%. (Belkins)
- Vice presidents were the hardest group to reach, at 0.32%. (Belkins)
- Firms with 11 to 50 employees replied at 0.49%, second only to the smallest firms. (Belkins)
Geographic Market
Cold email engagement also varies between countries and regions. Business communication norms, market conditions, and the composition of each dataset can affect regional benchmarks, making local comparisons particularly valuable for international campaigns.
- North America had the highest reply rates, followed by Western Europe and the UK. (Saleshandy)
- US recipients replied at 0.51% across more than 5.6 million emails, and Poland led all countries at 1.43%. (Belkins)
- Canada replied at 0.63% across 266,000 emails, above both the US and the UK. (Belkins)
1.43%
reply rate
Poland
0.63%
reply rate
Canada
0.51%
reply rate
United States
Recipient Attitudes and Engagement Statistics
Campaign analytics show how recipients behave, but survey research provides another perspective on why they engage or ignore outreach. These findings cover the reasons people reject cold emails, their general attitudes toward unsolicited messages, and the factors that make engagement more likely.
The consumer figures from EmailToolTester come from a Mechanical Turk survey of US adults (July 2024). Its sample size is stated as both 1,800 and 1,869, and its age distribution is unusual.
Why Recipients Ignore Cold Emails
Not every unanswered email is a timing problem. Recipients may ignore outreach because it feels irrelevant, overly promotional, or disconnected from their responsibilities. Survey findings help identify the complaints that senders should address first.
- 65% of decision makers say cold emails fail because they feel too sales-focused, now the top complaint. (Hunter)
- 61% cite irrelevance, and 48% call out generic, impersonal messaging. (Hunter)
- 73% of B2B buyers actively avoid suppliers who send irrelevant outreach. (BlazeHive)
65%
of decision makers say cold emails are too sales-focused
61%
of decision makers complain about irrelevant outreach
48%
of decision makers cite generic, impersonal messaging
How Recipients React to Cold Emails
People respond to unsolicited messages in different ways, from reading without replying to deleting or reporting them as spam. Understanding these behaviors provides context for the low engagement rates commonly reported in cold email studies.
- 44.7% think cold emails are trustworthy, while 36.2% do not. (EmailToolTester)
How Consumers Respond to Cold Emails
- 50.9% usually don’t engage with cold emails at all
- 20% read cold emails but don’t respond
- 13.7% delete them straight away
- 10.3% mark them as junk
Cold Email Value and Reply Frequency
- 28% say they never receive valuable cold emails
- 40% receive a useful one about once a week
- 33% haven’t replied to any cold email in the past year
- 32% have replied to five or more
Source: EmailToolTester
What Makes Recipients More Likely to Engage
Recipients may become more receptive when an email offers something relevant, comes from a familiar company, or captures their attention. Survey responses help identify which factors people believe would influence their willingness to engage.
- 46.2% say a promotional offer would make them engage with a cold email. (EmailToolTester)
- 46% say company familiarity would make them engage. (EmailToolTester)
- 42.6% say an attention-grabbing subject line would make them engage. (EmailToolTester)
- 51.8% would engage more with a cold email from a company they had previously purchased from. (EmailToolTester)
Cold Email Trends and Year-over-Year Changes
Cold email performance isn’t static. Changes in inbox filtering, outreach volume, recipient expectations, and sending practices can affect results over time. Comparing recent benchmarks helps identify whether engagement is improving or declining, although differences between studies should still be considered.
- The average reply rate was 5.1% in 2024, down from about 7% the year before. (Martal)
- Belkins campaigns averaged 0.50% in the first half of 2025 and 0.40% in the second, a 20% drop within one year. (Belkins)
Conclusion
What stands out most in the cold email marketing statistics is that success rarely comes from luck or volume alone. The strongest campaigns tend to stay concise, speak to a relevant audience, and follow up with patience. They also protect their sender reputation, which keeps every message within reach of the inbox.
Whether you’re sending your first campaign or refining your hundredth, these benchmarks give you a reliable place to start. Treat them as a guide rather than a rulebook, and test what works for your audience. At the end of the day, better results come from steady improvements and real care for the reader.