Few products in tech history have grown quite like ChatGPT. Within five days of its late 2022 launch, it had a million users. Within two months, it had a hundred million. These aren’t just impressive ChatGPT statistics — they’re a signal that something genuinely shifted in how people interact with technology. The platform now processes over 2.5 billion queries daily, and its revenue tripled in a single year. That kind of trajectory demands a closer look.
In this article, we break down the numbers behind ChatGPT’s rise — from user growth and web traffic to revenue, demographics, and enterprise adoption. Whether you’re a marketer, developer, or simply curious, the data paints a fascinating picture of where AI stands right now.
ChatGPT User Statistics: Growth & Milestones
ChatGPT’s rise from zero to nearly one billion weekly active users in just over three years stands as one of the most dramatic user adoption stories in consumer technology history.
The ChatGPT statistics behind this growth are staggering — Weekly Active Users (WAU) more than doubled in the twelve months between February 2025 and February 2026, and the trajectory shows no signs of slowing.
ChatGPT User Growth Statistics: All-Time Growth Timeline
The timeline below highlights the most important ChatGPT user statistics number of users milestones since launch. These figures show how quickly the product moved from early adoption to mainstream global use.
- ChatGPT reached 1 million users within 5 days of its December 2022 launch. (Technology Checker)
- It hit 100 million users in roughly 2 months (February 2023) — the fastest any consumer app has ever achieved this milestone. (Technology Checker)
- By the end of 2023, the platform had grown to 180 million users. (Technology Checker)
- WAU more than doubled in 12 months: 400M (Feb 2025) → 900M (Feb 2026). (Technology Checker)
- WAU grew 350% in the 18-month period leading up to February 2026. (Technology Checker)
- ChatGPT is projected to surpass 1 billion active users in 2026. (Business of Apps)
Full WAU History
This table gives a clearer view of ChatGPT active users statistics over time, using weekly active users as the core growth metric.
| Date | Weekly Active Users |
| Dec 2022 | 1M |
| Jan 2023 | 57M |
| Feb 2023 | 100M |
| Sep 2023 | 150M |
| Aug 2024 | 200M |
| Oct 2024 | 250M |
| Dec 2024 | 300M |
| Feb 2025 | 400M |
| Mar 2025 | 500M |
| Jul/Sep 2025 | 700M |
| Oct 2025 | 800M |
| Feb 2026 | 900M |
Speed to 100 Million Users: Platform Comparison
For context, ChatGPT’s two-month ramp to 100M users dwarfs every comparable platform. Only Instagram Threads (launched years after ChatGPT established the norm for viral AI tools) achieved it faster.
| Platform | Time to 100M Users |
| Instagram Threads | 2 days |
| ChatGPT | ~2 months |
| TikTok | 9 months |
| YouTube | 18 months |
| 30 months | |
| 54 months | |
| 60 months | |
| Spotify | 132 months |
| Netflix | 216 months |
ChatGPT Usage Statistics: Traffic & Engagement
ChatGPT.com has transformed from a novelty site into one of the most-visited properties on the internet. Monthly visits crossed the 5 billion mark in mid-2025 and have remained in that range through early 2026.
ChatGPT Monthly Website Visits
The following ChatGPT usage statistics show how web traffic scaled from early 2023 through April 2026. This data is useful for understanding not just adoption, but repeat usage and overall demand.
| Month | Visits |
| Jan 2023 | 0.62B |
| Feb 2023 | 1.0B |
| Nov 2023 | 1.7B |
| Jan 2024 | 1.6B |
| Apr 2024 | 1.81B |
| Jul 2024 | 2.44B |
| Aug 2024 | 2.6B |
| Sep 2024 | 3.1B |
| Oct 2024 | 3.7B |
| Dec 2024 | 3.7B |
| Jan 2025 | 3.8B |
| Feb 2025 | 3.9B |
| Mar 2025 | 4.5B |
| Apr 2025 | 5.1B |
| May 2025 | 5.5B |
| Jun 2025 | 5.4B |
| Jul 2025 | 5.72B |
| Sep 2025 | 5.8B |
| Oct 2025 | 6.16B |
| Dec 2025 | 5.50B |
| Jan 2026 | 5.72B |
| Feb 2026 | 5.35B |
| Mar 2026 | 5.73B |
| Apr 2026 | 5.51B |
Traffic grew 35% from January 2025 (3.8B) to June 2025 (5.4B), a pace that few web properties sustain at this scale. (Page Traffic)
ChatGPT Daily Usage Statistics and Real-Time Traffic
These ChatGPT daily usage statistics show the scale of real-time demand. They also help explain why ChatGPT concurrent users statistics matter for infrastructure, reliability, and AI adoption analysis.
~190–193 million
visits per day
114.2 million
daily active users
2,238
visits per second
on an ongoing basis
2.5 billion
and more queries processed per day
as of July 2025
10 million
more than 10 million queries per day
In the week after launch alone
ChatGPT Engagement and Session Behavior
Traffic volume alone does not explain ChatGPT’s growth. These engagement metrics show how users behave once they arrive on the platform.
| Metric | Value |
| Average session duration | ~6–7 minutes |
| Average pages per visit | 4.14 |
| Bounce rate | 30.07% |
| Desktop traffic share | 73.11% |
| Mobile traffic share | 26.89% |
| Social media traffic from YouTube | 62% |
(Demand Sage / Page Traffic / Social Shepherd)
The relatively low bounce rate (30%) and above-average session length signal strong user intent — people are arriving to work with the tool, not just browse it.
OpenAI ChatGPT Usage Statistics: Revenue
ChatGPT’s financial trajectory is as striking as its user growth. Annual revenue has roughly tripled year-over-year for three consecutive years, driven by both subscription growth and a mobile revenue explosion.
ChatGPT Annual Revenue Statistics
The revenue figures below show how quickly ChatGPT has moved from viral product to major commercial engine for OpenAI.
| Year | Revenue | YoY Growth |
| 2023 | $1.6B | — |
| 2024 | $3.7B | ~131% |
| 2025 | $13.1B | ~254% |
OpenAI ChatGPT Revenue Run-Rate Statistics
Annualized run-rate revenue gives another view of ChatGPT and OpenAI’s commercial momentum. ARR is useful because it captures the annualized rate at a specific point in time, not total dollars collected that year.
Annualized Run-Rate Revenue (ARR) ARR = the annualized rate at a point in time, not total dollars collected that year.
| Year-End | ARR | YoY Growth |
| 2023 | $2B | – |
| 2024 | $6B | ~200% |
| 2025 | $20B | ~233% |
| Mar 2026 | $25B | – |
- OpenAI’s internal 2026 revenue target is $29.4 billion. (Technology Checker)
- The company has a long-term target of $125 billion by 2029. (Demand Sage)
ChatGPT App Revenue and Mobile In-App Revenue
Mobile revenue has been one of the most dramatic growth stories within ChatGPT’s financials.
- Mobile app revenue surged 673% year-over-year: $174M (2024) → $1.35 billion (2025). (Technology Checker)
- In-app revenue grew 591.6% over the 12-month period from March 2024 to March 2025, with 12 consecutive months of month-over-month growth. (Demand Sage)
- In March 2026, U.S. mobile revenue alone reached $275 million in a single month — $221M from iOS and $54M from Google Play. (Technology Checker)
ChatGPT Monthly In-App Revenue Breakdown
The monthly figures below show how quickly mobile monetization accelerated, especially between 2024 and 2026.
| Month | In-App Revenue |
| Mar 2024 | $15.6M |
| Apr 2024 | $16.4M |
| May 2024 | $21.5M |
| Jun 2024 | $23.7M |
| Jul 2024 | $26.5M |
| Aug 2024 | $29.6M |
| Sep 2024 | $34.4M |
| Oct 2024 | $46.2M |
| Nov 2024 | $50.1M |
| Dec 2024 | $59.8M |
| Jan 2025 | $70.4M |
| Feb 2025 | $75.2M |
| Mar 2025 | $108.0M |
| Feb 2026 | $227.0M |
ChatGPT Operating Costs
The cost side of ChatGPT statistics matters because scale is not free. These figures show the tension between massive usage, fast revenue growth, and heavy compute spending.
- Running ChatGPT was estimated to cost approximately $3 million per month as of December 2022 — a figure that has grown substantially since. (Business of Apps)
- ChatGPT running costs were estimated at $700,000 daily in 2024. (Gulf News)
- Despite generating up to $13 billion in annual revenue from ChatGPT and LLM access fees, OpenAI spends up to $1.4 billion on computing resources alone. (WindowsCentral)
- OpenAI’s Q1 2026 financials revealed a stark reality — for every dollar of revenue generated, the company lost an additional $1.22, totaling roughly $6.95 billion in losses on a non-GAAP basis. (Where’s Your Ed At)
ChatGPT Plus User Statistics: Subscribers & Pricing
Subscriber data is one of the clearest signals of monetization strength. These ChatGPT Plus user statistics and paid plan figures show how quickly free usage has converted into recurring revenue.
ChatGPT Paid Subscriber Growth
Paid subscriber growth has mirrored the broader adoption curve, with the second half of 2025 seeing a particularly sharp jump as new pricing tiers and expanded international access took hold.
| Period | Paid Subscribers |
| H2 2023 | 0.5M |
| H1 2024 | 9.8M |
| H2 2024 | 16M |
| H1 2025 | 25M |
| H2 2025 | 50M |
ChatGPT Subscription Tiers & Pricing
The pricing table below summarizes the core paid ChatGPT plans available across individual, team, professional, and enterprise use cases.
| Plan | Price |
| ChatGPT Plus | $20/month |
| ChatGPT Team | $25/user/month |
| ChatGPT Pro | $200/month |
| ChatGPT Enterprise | Custom pricing |
ChatGPT Subscription Retention Rates (January 2025 Cohort)
Retention is notably strong at the enterprise tier, where deep workflow integration creates high switching costs.
| Plan | 3-Month Retention | 6-Month Retention | 1-Year Retention |
| ChatGPT Plus | 73% | 64% | 59% |
| ChatGPT Team | 85% | 78% | 68% |
| ChatGPT Enterprise | 95% | 92% | 88% |
ChatGPT App Download Statistics
One of the less surprising ChatGPT statistics is that ChatGPT claimed the title of the most downloaded app of 2025, beating both TikTok and Instagram. A milestone that underscores how rapidly AI tools have entered mainstream consumer behavior.
Download Milestones
These ChatGPT app download statistics show how quickly the mobile app became a mainstream consumer product after launching in May 2023.
- 770 million total installs in 2025 alone — making it the world’s most downloaded app that year. (Business of Apps)
- 1.44 billion cumulative downloads since the app launched in May 2023. (Demand Sage)
- The single highest monthly download figure on record: 73.4 million in December 2025. (Demand Sage)
Semi-Annual Download Totals
The semi-annual download totals show the acceleration pattern more clearly than individual months alone.
| Period | Downloads |
| H1 2023 | 13M |
| H2 2023 | 90M |
| H1 2024 | 105M |
| H2 2024 | 174M |
| H1 2025 | 350M |
| H2 2025 | 420M |
Monthly Downloads Breakdown
This monthly breakdown gives a more granular view of ChatGPT app downloads statistics, including the inflection point that began in late 2024.
| Month | Downloads |
| May 2023 | 4.3M |
| Jun 2023 | 24.0M |
| Jul 2023 | 9.6M |
| Aug 2023 | 15.0M |
| Sep 2023 | 16.8M |
| Oct 2023 | 17.9M |
| Nov 2023 | 21.3M |
| Dec 2023 | 21.7M |
| Jan 2024 | 19.8M |
| Feb 2024 | 17.5M |
| Mar 2024 | 17.1M |
| Apr 2024 | 15.3M |
| May 2024 | 22.8M |
| Jun 2024 | 22.3M |
| Jul 2024 | 18.9M |
| Aug 2024 | 24.5M |
| Sep 2024 | 36.6M |
| Oct 2024 | 46.3M |
| Nov 2024 | 42.5M |
| Dec 2024 | 43.3M |
| Jan 2025 | 40.6M |
| Feb 2025 | 44.7M |
| Mar 2025 | 64.3M |
| Dec 2025 | 73.4M |
| Feb 2026 | 68.0M |
ChatGPT Statistics in the AI Market: Market Share & Competitive Landscape
Despite holding a commanding lead, ChatGPT’s share of generative AI web traffic has declined from near-total dominance to a still-leading but more competitive ~57–73% range, as Google Gemini, Perplexity, and Claude each grow their audiences.
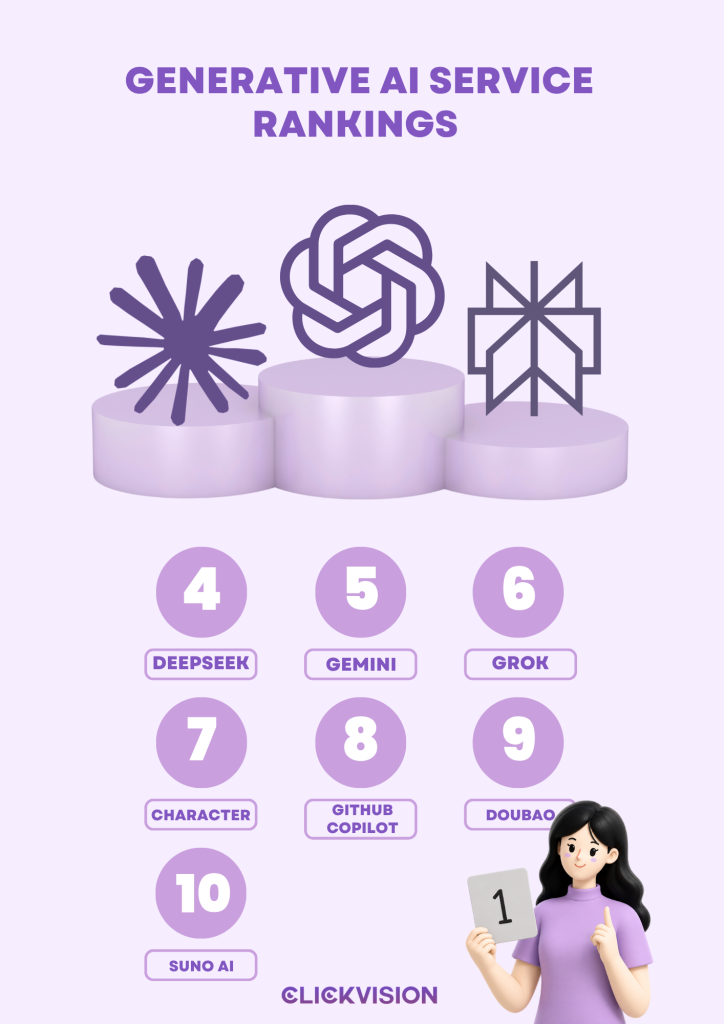
ChatGPT Competitors Statistics: Generative AI Service Rankings (May 2026)
The rankings below place ChatGPT’s current position in the broader AI chatbot market. They help show why ChatGPT remains dominant even as the competitive landscape becomes more crowded.
- ChatGPT — #1 every single day for 85+ consecutive days as of May 18, 2026
- Claude
- Perplexity
- DeepSeek
- Google Gemini
- Grok / xAI
- Character.AI
- GitHub Copilot
- Doubao (ByteDance) — new entrant May 2026
- Suno AI
ChatGPT Web Traffic Share vs. Competitors (GenAI)
The following market-share data shows how ChatGPT usage statistics compare with other generative AI platforms over time.
ChatGPT’s share of generative AI web traffic dropped from 87% in early 2025 to 56.72% in March 2026 — a 30-point decline over 12 months as rivals expanded rapidly. (Technology Checker)
Note: Measures ChatGPT’s share of traffic across all generative AI platforms, including Gemini’s standalone site.
| Quarter | ChatGPT Share |
| Mar 2025 | 87% |
| Jun 2025 | 78% |
| Sep 2025 | 72% |
| Dec 2025 | 64% |
| Mar 2026 | 56.72% |
- Google Gemini grew its web traffic share from 6% to 25.46% between March 2025 and March 2026 — the largest absolute gain of any AI chatbot. (Technology Checker)
- Claude grew from 1.4% to 6.02% over the same period — the third-largest gainer. (Technology Checker)
Market Share — Generative AI Chatbot (StatCounter)
This table shows AI chatbot page-view share across major platforms. It is useful for comparing ChatGPT’s dominance against Gemini, Perplexity, Claude, DeepSeek, and Microsoft.
Note: Measures AI chatbot page views only, which undercounts Gemini since most of its usage occurs embedded within Google Search rather than as a standalone site.
| Month | ChatGPT | Google Gemini | Perplexity | Claude | DeepSeek | Microsoft |
| Mar 2025 | 81.39% | 3.29% | 14.09% | 0.25% | 0.64% | 0.34% |
| Apr 2025 | 84.21% | 2.31% | 12.07% | 0.30% | 0.88% | 0.23% |
| May 2025 | 79.79% | 1.95% | 11.83% | 0.46% | 0.80% | 5.18% |
| Jun 2025 | 79.86% | 1.02% | 14.83% | 1.11% | 1.11% | 2.19% |
| Jul 2025 | 82.65% | 2.19% | 8.03% | 0.90% | 1.60% | 4.59% |
| Aug 2025 | 81.47% | 2.11% | 7.36% | 0.83% | 2.87% | 5.36% |
| Oct 2025 | 81.13% | 2.82% | 10.82% | 0.99% | 0.19% | 4.05% |
| Jan 2026 | 80.49% | 7.18% | 7.89% | 0.92% | 0.01% | 3.50% |
| Feb 2026 | 79.98% | 7.50% | 7.88% | 1.37% | 0.01% | 3.26% |
| Apr 2026 | 76.85% | 9.00% | 7.73% | 2.66% | 0.01% | 3.76% |
Conversion Rate by AI Platform
Traffic from AI-referred sources converts at a much higher rate than traditional search, making these platforms strategically valuable for businesses beyond raw traffic volume.
| Platform | Conversion Rate |
| ChatGPT | 16% |
| Perplexity | 10.5% |
| Claude | 5% |
| Google Gemini | 3% |
| Google Organic | 1.8% |
ChatGPT traffic converts at nearly 9x the rate of Google organic search, though AI-referred traffic still represents less than 1% of overall organic traffic. (Technology Checker)
ChatGPT User Statistics by Demographics
ChatGPT’s user base has diversified significantly since launch. The ChatGPT statistics on demographics tell an interesting story — while early adopters skewed heavily male and tech-oriented, the platform has attracted a much broader population over three years.
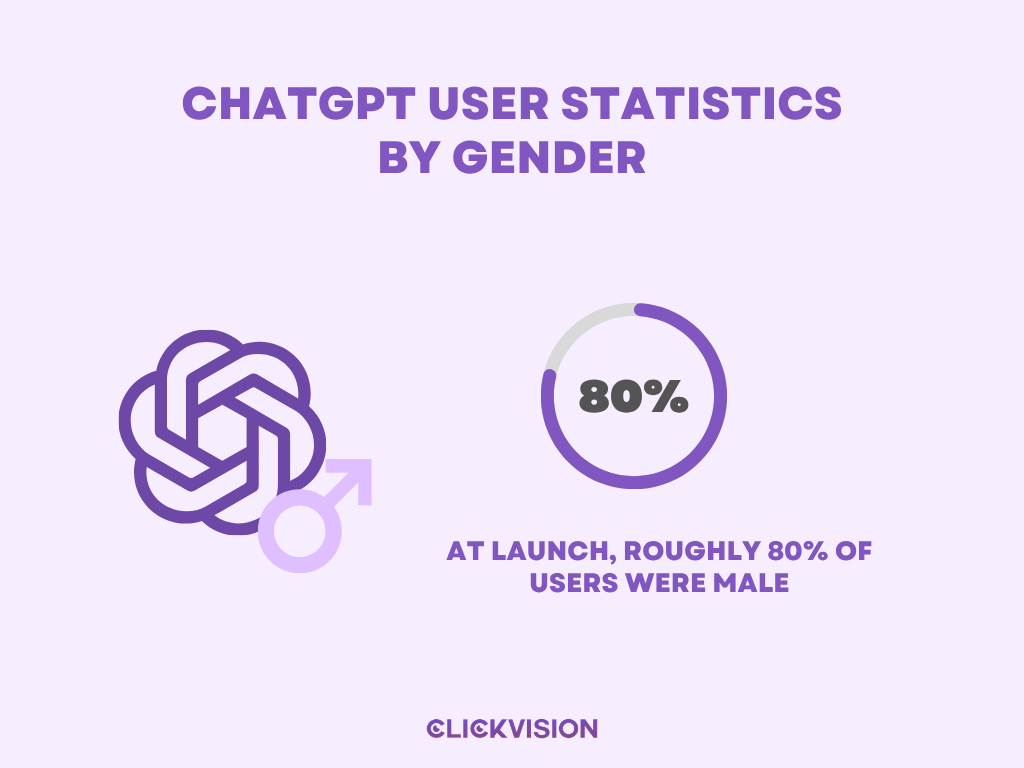
ChatGPT User Statistics by Gender
Gender data helps show how the ChatGPT audience has changed since launch and how adoption has broadened beyond the original early-adopter base.
54.7%
male users
45.3%
female users
- At launch, roughly 80% of users were male (Technology Checker)
ChatGPT User Statistics by Age Distribution
The table below breaks down ChatGPT users by age group. It shows why younger adults remain the strongest adoption segment, while older age groups are still catching up.
| Age Group | Share of Users |
| 18–24 | ~23% |
| 25–34 | ~30% |
| 35–44 | ~19% |
| 45–54 | ~14% |
| 55–64 | ~9% |
| 65+ | ~5% |
- 18–34 year olds account for approximately 53% of the total user base. (Demand Sage)
- Close to half of all interactions come from users under 26. (Chanty)
- 43% of U.S. adults aged 18–29 have tried ChatGPT — the most active domestic age group. (Social Shepherd)
- Only 6% of U.S. adults aged 65+ have ever used ChatGPT. (Social Shepherd)
ChatGPT Usage by Country Statistics
ChatGPT usage is genuinely global, with the United States and India now nearly tied as the top two markets — an indicator of how strongly the platform has penetrated the developing world.
ChatGPT Users by Country
These ChatGPT user statistics by country show where the platform has built its largest user bases. They also help explain why international pricing and localization matter for future growth.
| Country | Estimated Users | Notes |
| United States | 205 million | ~15–19% of global traffic |
| India | 198 million | ~9.5% — doubled in one month after ChatGPT Go launched at $4.50/month |
| Brazil | 69.6 million | — |
| Canada | 64.8 million | — |
| France | 51.6 million | — |
ChatGPT Usage Statistics by Country: Visitor Share (May 2026)
The visitor-share data below adds another layer to ChatGPT usage by country statistics by showing traffic distribution across major markets.
| Country | Share |
| United States | 17.1% |
| India | 16.5% |
| Brazil | 5.8% |
| Canada | 5.4% |
| France | 4.3% |
| Spain | 3.7% |
| Mexico | 3.6% |
| United Kingdom | 2.7% |
| Italy | 2.5% |
| Philippines | 2.5% |
| Germany | 2.4% |
| Australia | 1.8% |
OpenAI ChatGPT Usage Statistics by Country: Usage Frequency (Reuters Institute)
This table focuses on frequency rather than total traffic. It shows how often users in selected countries report using ChatGPT on a daily, weekly, or monthly basis.
| Country | Daily | Weekly | Monthly |
| United States | 7% | 11% | 4% |
| Argentina | 5% | 7% | 5% |
| Denmark | 3% | 8% | 9% |
| United Kingdom | 2% | 7% | 6% |
| France | 2% | 7% | 5% |
| Japan | 1% | 5% | 4% |
Japan reports the lowest daily usage rate of any surveyed country at just 1%. (Social Shepherd)
UK ChatGPT Usage Spotlight
The UK data gives a closer look at one major English-speaking market and how ChatGPT fits into broader everyday AI use.
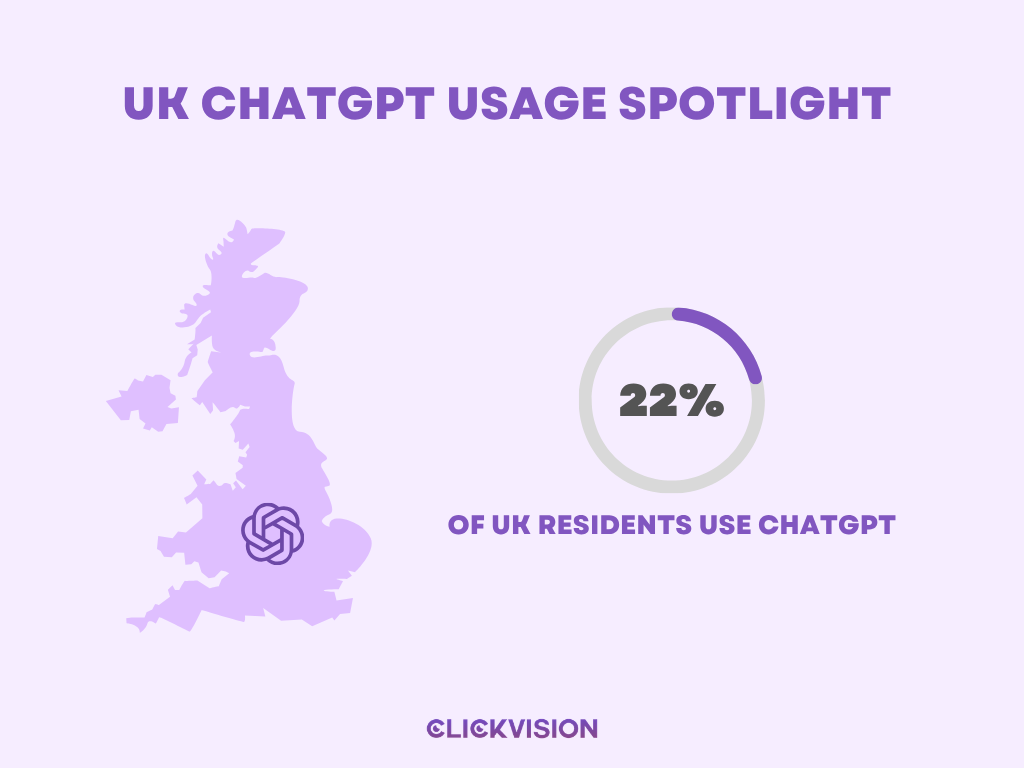
- 22% of UK residents use ChatGPT. (Social Shepherd)
- 70% of UK respondents used AI in daily life in the past six months — below the global average of 82%. (Social Shepherd)
- Top UK AI use cases:
32%
customer support
20%
route planning
14%
product recommendations
Use Cases
ChatGPT is far more than a productivity tool — the majority of its interactions are personal and exploratory. That said, its role in professional, commercial, and purchasing decisions is growing rapidly.
General ChatGPT Usage Patterns
The following figures show what people actually use ChatGPT for. These ChatGPT usage statistics are important because they reveal demand beyond coding, productivity, and enterprise workflows.
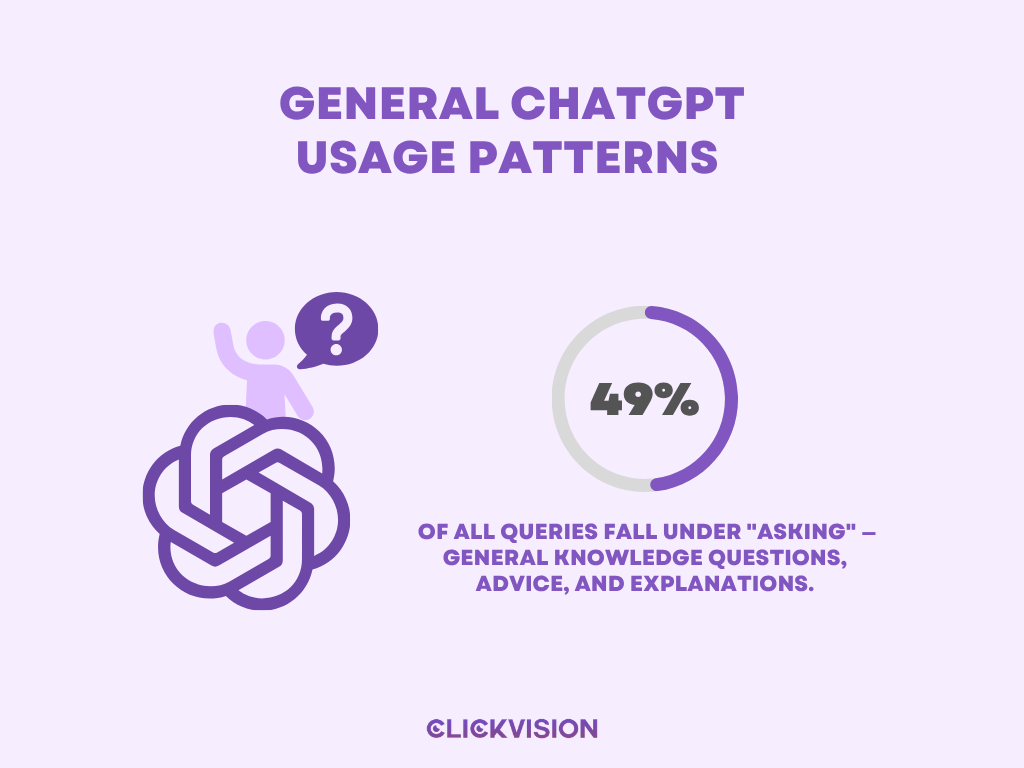
- 49% of all queries fall under “asking” — general knowledge questions, advice, and explanations. (Technology Checker)
- An estimated 70–73% of all conversations are personal or non-work related; the remaining 27–30% serve work, study, or productivity purposes. (Chanty)
- Education-related interactions account for roughly 10% of all chats. (Chanty)
- Code and programming help makes up only about 4.2% of all messages. (Chanty)
ChatGPT Use Cases Breakdown (April 2026)
This table breaks down common ChatGPT use cases by share. It shows the mix of research, academic work, coding, writing, commercial research, and marketing activity.
| Use Case | Share |
| General Research | ~36.4% |
| Academic Research | ~18.2% |
| Coding Assistance | ~14.7% |
| Email Composition | ~14.0% |
| Commercial Research | ~6.3% |
| Marketing Copywriting | ~5.0% |
ChatGPT vs. Google: Response Quality Comparison
The comparison below puts ChatGPT and Google side by side across response length, sources, readability, and citation patterns.
| Metric | ChatGPT | |
| Avg. response length | 1,686 chars | 997 chars |
| Sentences per response | 22 | 10 |
| Sources per response | 10.42 | 9.26 |
| Subjectivity score (lower = more factual) | 0.44 | 0.48 |
| Readability (Coleman–Liau grade level) | 12.85 | 12.75 |
| Wikipedia citations | 47.9% | 5.7% |
| Reddit citations | 11.3% | 21% |
Industries Using ChatGPT in Purchasing Decisions (May 2026)
The financial stakes of AI-influenced purchasing decisions are enormous — and growing across every sector.
| Industry | % Using ChatGPT | Est. Financial Impact |
| Travel & Hospitality | 47% | $1.48 trillion |
| Retail & CPG | 36% | $1.11 trillion |
| IT Services | 34% | $936 billion |
| Lifestyle, Health & Wellness | 32% | $891 billion |
| Food & Beverage | 32% | $546 billion |
| Home Services | 31% | $385 billion |
| Healthcare | 29% | $378 billion |
| Automotive | 29% | $243 billion |
| B2B SaaS | 28% | $229 billion |
| Advertising & Marketing | 27% | $156 billion |
| Fintech | 25% | $135 billion |
| Insurance | 23% | $104 billion |
ChatGPT Workplace Usage Statistics: Productivity & Workplace Impact
The productivity case for ChatGPT is increasingly data-backed. Most users report meaningful time savings, and independent research from MIT and the University of Chicago adds academic weight to those claims.
ChatGPT Productivity Statistics
These workplace-focused ChatGPT statistics show both the upside and the friction of using AI at work. The productivity gains are real, but so is the revision burden when outputs are wrong or incomplete.
- 39% of employees report measurable productivity gains from AI use. (Chanty)
- Typical users save around 40–60 minutes per workday; heavy users reclaim 10 or more hours per week. (Chanty)
- An MIT and University of Chicago study found ChatGPT reduced writing task completion time by ~40% while improving output quality by approximately 18%. (Chanty)
- 81% of generative AI users say the technology has improved their productivity; 43% describe the improvement as significant. (Data Forest)
- More than 75% of users say AI improves the speed or quality of their work, or both. (Chanty)
- 1 in 5 U.S. adults uses ChatGPT for work-related tasks. (Demand Sage)
- 57% of content marketers use AI for content drafting. (Demand Sage)
- 88% of organizations now use AI in at least one business function, per a McKinsey 2025 survey. (Data Forest)
AI quality isn’t flawless, however: 44% of employees regularly fix AI-generated mistakes, and 58% spend at least 3 hours per week revising or redoing AI outputs. (Chanty)
Top Areas for AI ROI
| Business Function | Reporting High ROI |
| Customer service & experience | 74% |
| IT operations & infrastructure | 69% |
| Planning & decision-making | 66% |
OpenAI ChatGPT User Statistics: Enterprise Adoption
ChatGPT has moved from experimentation to core infrastructure at major organizations, with Fortune 500 adoption effectively near-universal.
ChatGPT Enterprise Adoption Statistics
These enterprise ChatGPT statistics show how deeply the platform has entered business workflows, from Fortune 500 usage to workplace seats and global business clients.
- ChatGPT has been adopted by 93% of Fortune 500 companies. (Technology Checker)
- The platform now has 7 million workplace seats, a 9x year-over-year increase. (Technology Checker)
- 1.5 million business clients globally, with over 1 million outside the US. (Technology Checker)
- Enterprise adoption grew 340% year-over-year. (Technology Checker)
- PwC alone has deployed 100,000+ ChatGPT Enterprise seats. (Technology Checker)
- Notably, 79% of OpenAI enterprise users also pay for Anthropic — suggesting enterprises are running ChatGPT and Claude side by side rather than choosing one exclusively. (Technology Checker)
- 49% of companies are currently using ChatGPT, and 93% of those plan to expand their usage. (Social Shepherd)
Top Enterprise Use Cases
The use-case breakdown below shows where enterprise users are applying ChatGPT most often inside organizations.
| Use Case | % of Enterprise Users |
| Data analysis and reporting | 60% |
| Content generation (text and images) | 51% |
| Personalization and customer experience | 42% |
| Code generation and debugging | ~35% |
| Internal knowledge management | ~28% |
Enterprise Adoption by Sector
This sector-level view shows where enterprise ChatGPT adoption is currently strongest.
| Sector | Adoption Rate |
| Travel & Hospitality | 18% |
| Retail & CPG | 16% |
| IT | 14% |
| Health & Lifestyle | 13% |
| Food | 13% |
Professional ChatGPT Usage Rates
Professional usage rates show how embedded ChatGPT has become in knowledge work, marketing, journalism, software development, and content workflows.
65%
of marketers use ChatGPT regularly
64%
of journalists use ChatGPT regularly
63%
of software developers use ChatGPT regularly
- Top professional AI applications: optimizing content for email/SEO (51%), content creation (50%), brainstorming campaigns (45%). (Social Shepherd)
ChatGPT Developer Statistics & SaaS Adoption
The developer ecosystem around ChatGPT has grown explosively. ChatGPT statistics show API integrations have tripled, with SaaS adoption becoming the norm for new AI-native products.
- 42% of new SaaS platforms with AI capabilities that launched in 2025 rely on OpenAI models. (Technology Checker)
- OpenAI now has 3 million active developer accounts — a 5x increase since 2022. (Technology Checker)
- 1.3 million U.S. developers have created projects on OpenAI’s platform. (Technology Checker)
- ChatGPT API integration signals have increased 3x across monitored domains since January 2025. (Technology Checker)
ChatGPT vs. Claude: Developer Comparison (May 2026)
The compares ChatGPT and Claude across developer-relevant metrics, including context window, pricing, user scale, and crawl footprint.
| Metric | ChatGPT | Claude |
| Context window | 128K tokens | 200K tokens |
| API pricing | $5–15 per 1M tokens | $3–15 per 1M tokens |
| Weekly active users | 900M | Growing rapidly (#2 in GenAI rankings) |
| Web crawl footprint | 13.64% (combined OpenAI bots) | 10.67% (ClaudeBot) |
ChatGPT Education Statistics: Academic & Education Use
ChatGPT has become deeply embedded in academic workflows, particularly among younger students — raising ongoing questions about academic integrity and appropriate AI use policies.
ChatGPT Academic Usage Statistics
The education data below shows both widespread student adoption and ongoing concerns around copying, assessment integrity, and responsible AI use.
- Last year, 26% of U.S. teens used ChatGPT for schoolwork, up from 13% in 2023 — usage doubled in two years. (Demand Sage)
- AI tool awareness among students exceeds 85%. (Chanty)
- 8% of students admit to directly copying ChatGPT output into academic work. (Chanty)
- Only about 1 in 5 students considers directly copying AI output to be a serious academic integrity violation. (Chanty)
- 9 out of 10 UK undergraduates have used generative AI tools in their academic assessments. (Social Shepherd)
ChatGPT Trust Statistics: Public Trust & Safety Concerns
As ChatGPT scales, concern about its risks — from misinformation to data privacy to over-reliance — has grown alongside it.
ChatGPT Safety and Risk Statistics
These figures show the trust challenges surrounding ChatGPT and other large language models. The risks are not theoretical: misinformation, sensitivity, hallucinations, and therapeutic reliance all appear in the data.
- 83% of people are concerned that AI accelerates the spread of misinformation. (Chanty)
- 82% of users describe their ChatGPT conversations as sensitive or highly sensitive. (Chanty)
- Even the most accurate large language models hallucinate in approximately 25% of factual claims. (Chanty)
- 48.7% of users who both use AI and self-report mental health challenges say they rely on LLMs for therapeutic support. (Chanty)
OpenAI Funding Statistics: Valuation & Funding
OpenAI’s valuation has grown more than 36x since December 2022, and its February 2026 funding round set a global record for a single fundraising event.
OpenAI Valuation History
The valuation timeline below provides context for the financial scale behind ChatGPT’s growth and OpenAI’s broader market position.
| Date | Valuation |
| Dec 2022 | $20B |
| Feb 2023 | $29B |
| Feb 2024 | $80B |
| Oct 2024 | $157B |
| May 2025 | $300B |
| Aug 2025 | $500B |
| Feb 2026 | $730B |
| Mar 2026 | $852B |
(Business of Apps) (CNBC)
OpenAI Funding Overview
The funding figures below show how aggressively capital has flowed into OpenAI as ChatGPT adoption has expanded.
- OpenAI has raised over $140 billion in funding across 15 rounds. (Business of Apps)
- The February/March 2026 round of $122 billion — led by Amazon, Nvidia, and SoftBank — is the largest single funding round in history. (CNBC)
- Amazon has committed to investing $50 billion in OpenAI. (Business of Apps)
Key Funding Rounds
This summarizes major funding rounds behind OpenAI’s expansion, from early accelerator funding to large-scale strategic investment.
| Date | Amount | Lead Investor(s) |
| Aug 2016 | $120K | Y Combinator |
| Jul 2019 | $1B | Microsoft |
| Jan 2023 | $10B | Microsoft |
| Apr 2023 | $300M | a16z / Sequoia / Thrive |
| Oct 2024 | $6.6B | Thrive Capital |
| Mar 2025 | $40B | SoftBank |
| Dec 2025 | $1B | Disney |
| Feb 2026 | $122B | Amazon / Nvidia / SoftBank |
| Mar 2026 | $10B | a16z / D.E. Shaw / MGX / TPG / T. Rowe Price |
(Business of Apps) (CNBC)
ChatGPT Bot Statistics: AI Bot Crawl Activity
OpenAI’s bots are among the most active crawlers on the web, ranking second only to Googlebot and Meta’s bots by crawl share — and the gap between crawling and referring traffic is strikingly large for most AI companies.
AI Bot Crawl Share (28 Days Ending May 18, 2026)
The crawl-share table below shows how OpenAI bots compare with other major web crawlers, including Googlebot, ClaudeBot, Bytespider, Bingbot, Applebot, and Amazonbot.
| Bot | Crawl Share |
| Googlebot | 27.85% |
| Meta-ExternalAgent | 13.96% |
| GPTBot | 11.97% |
| ClaudeBot | 10.67% |
| Bytespider (ByteDance) | 8.71% |
| Bingbot | 8.22% |
| Applebot | 7.13% |
| Amazonbot | 4.96% |
| OAI-SearchBot | 1.67% |
| Other | 4.86% |
Combined OpenAI bots (GPTBot + OAI-SearchBot): 13.64%. (Technology Checker)
- In the week of May 9, GPTBot surged to 18.71% while ClaudeBot dropped to 7.82% — a single-week gap of 10.89 percentage points. (Technology Checker)
- Bytespider (ByteDance) more than doubled its crawl share from 3.83% to 8.71% in 28 days, making it the fastest-growing crawler on the list. (Technology Checker)
AI Crawl Purpose Breakdown (28 Days Ending May 18, 2026)
This breakdown shows why AI crawler traffic matters: most crawling is tied to training or mixed-purpose activity, not direct search referrals.
| Purpose | Share |
| Training | 52.54% |
| Mixed Purpose | 36.06% |
| Search | 8.41% |
| User Action (agents) | 2.36% |
| Undeclared | 0.63% |
Training crawls outnumber search crawls by roughly 6-to-1. (Technology Checker)
Crawl-to-Referral Ratios (April 13–20, 2026)
This data illustrates a striking asymmetry: most AI companies crawl vastly more pages than they refer users back to, raising questions about the reciprocity of the web ecosystem.
| Company | Pages Crawled per Referral Sent |
| Anthropic | 13,528 : 1 |
| OpenAI | 1,252 : 1 |
| Perplexity | 95 : 1 |
| Mistral | 53 : 1 |
| Microsoft | 29 : 1 |
| 5 : 1 | |
| DuckDuckGo | 1.5 : 1 |
Broader Generative AI Market
ChatGPT sits at the center of an accelerating global AI adoption wave that extends well beyond any single platform.
- Over 1.1 billion people use AI apps worldwide, with ChatGPT being the most widely used. (Business of Apps)
- The generative AI market is projected to reach $407 billion by 2027. (Data Forest)
- AI is expected to contribute a 21% net increase to United States GDP by 2030. (Data Forest)
- ChatGPT adoption is growing in low- and middle-income countries at rates more than 4x higher than in high-income regions. (Chanty)
- 34% of U.S. adults have used ChatGPT at least once; among adults under 30, that figure climbs to nearly 60%. (Chanty)
- 79% of Americans are aware of ChatGPT, even if they haven’t used it. (Chanty)
Conclusion
The ChatGPT statistics covered in this article tell a story that goes beyond raw numbers. A platform that barely existed three years ago now shapes how people work, learn, shop, and make decisions — across nearly every industry and demographic. That kind of adoption, at that speed, is genuinely rare in consumer technology.
Ultimately, the data reflects something bigger than one product’s success. It points to a fundamental shift in how the world engages with AI. Whether you’re building a business, refining a strategy, or simply trying to stay informed, understanding where ChatGPT stands today gives you a clearer sense of where everything is heading.