A few years ago, Claude was barely on most people’s radar. Today, Claude has become one of the fastest-growing AI platforms in the world, and the latest Claude AI statistics show just how quickly adoption is accelerating across consumers, developers, and enterprises.
In this article, we break down the most important Claude AI user statistics for 2025 and 2026, including monthly active users, revenue growth, enterprise adoption, benchmark performance, and market share trends.
Key Takeaways
- Despite ChatGPT’s larger consumer market share, Claude is currently one of the fastest-growing AI platforms in enterprise adoption, coding workflows, and API usage.
- Claude reached 30 million monthly active users by mid-2025, while total estimated users across web, app, and API integrations approached 300 million.
- Claude’s web traffic exploded throughout 2025, growing from roughly 16 million to over 290 million monthly visits by February 2026.
- Anthropic’s share of enterprise LLM spending surged from 12% in 2023 to 40% in 2025, overtaking OpenAI in enterprise adoption momentum.
- Claude now powers 25+ billion API calls per month and integrates with over 6,000 enterprise applications, including Salesforce, Slack, and Notion.
- The company’s revenue growth has been extreme, scaling from $45M in 2023 to a $30B run-rate by April 2026.
- Claude Code became one of Anthropic’s biggest growth drivers, reaching a $2.5B run-rate by February 2026 while contributing to roughly 4% of all public GitHub commits worldwide.
- Enterprise adoption accelerated rapidly, with 70% of Fortune 100 companies using Claude and more than 1,000 customers spending over $1M annually.
- Claude continues to dominate coding-focused AI benchmarks, with Anthropic holding the lead in LLM coding performance for 18 consecutive months.
- Mobile usage now accounts for 54% of total Claude activity, while retention and repeat usage metrics suggest increasingly habitual daily engagement.
Claude AI User Statistics 2025: Monthly Active Users
Claude has gone from a niche developer tool to a mainstream AI platform fast – and the Claude AI user statistics from 2025 are starting to reflect that.
30M
monthly active users
globally by mid-2025
up 40% YoY
2.9M
monthly active app users
in January 2025
growing to 7.38M by December 2025 – 2.5x growth in 12 months.
10.27%
App MAU growth
in December 2025 alone
~300M
Total estimated users including indirect API, app, and web
Claude AI Usage Statistics: Website Traffic Growth
Claude’s web traffic was relatively flat through most of 2024, hovering under 20M monthly visits. Then something shifted. From January 2025 onwards, growth became almost vertical. Traffic tripled from 16M to 54M in just two months, and by February 2026 it had crossed 290M monthly visits. That’s roughly an 11x increase across 2025 alone.
Website Rankings
#86
Most-used AI app worldwide
(ranked in early 2025)
#192
Most-visited website globally (ranked in December 2025)
#7
in the AI category globally
(ranked in December 2025)
#4
in AI Chatbots and Tools in the US
(ranked in February 2026)
#125
Global rank improved from #215 (over 3 months to February 2026)
App Downloads
Downloads took off in Q3 2024, jumping from 600K to 2.1M in a single quarter. Growth continued steadily through Q1 2025 and peaked at 4.1M downloads in Q2 2025. Q3 2025 came in just slightly behind at 3.9M, suggesting the app has settled into a high but stable download rate rather than continuing to spike.
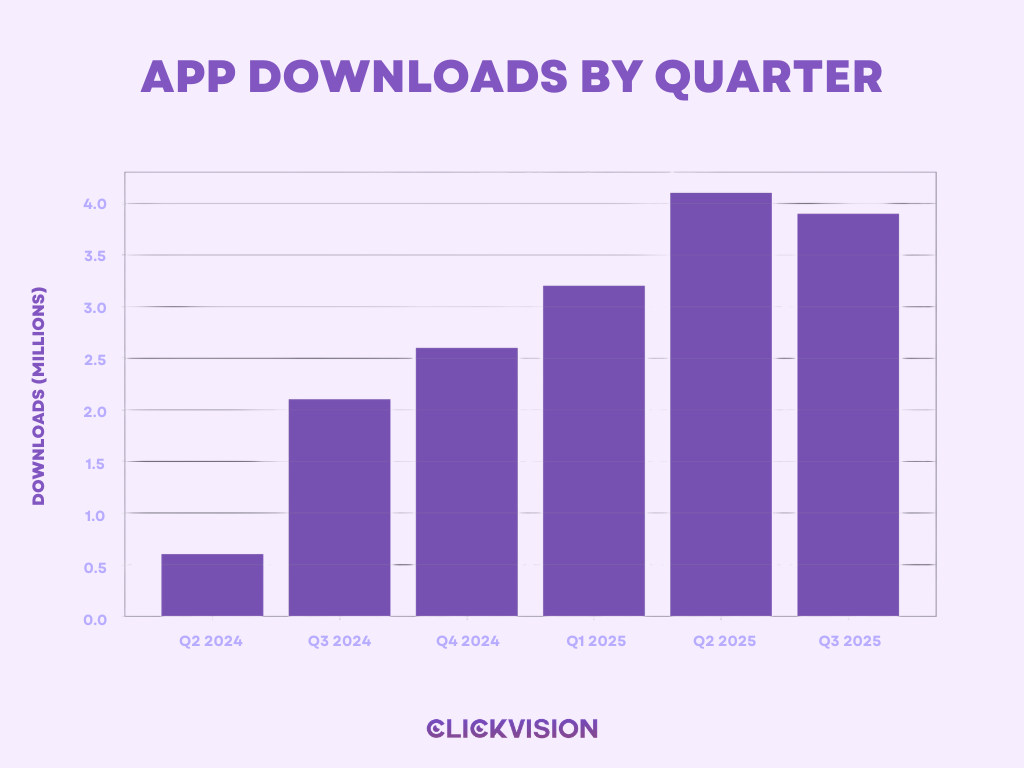
- App Store rating: 4.6 / 5.
Claude AI User Statistics and Engagement Trends
The latest Claude AI user statistics show strong engagement and retention across both mobile and desktop users. Session length, repeat usage, and satisfaction metrics all point to a platform with increasingly habitual usage patterns rather than casual experimentation.
13 min
Average session
duration
41%
of users return at
least 3x per week
29%
User retention rate increased YoY in 2024
92%
user satisfaction rate
26–38%
Bounce rate
3.9–4.3
Pages per visit
54%
of total Claude usage is now on mobile
Traffic Sources
The vast majority of Claude’s traffic — 78% — comes direct. People aren’t stumbling onto it through ads or social feeds; they’re typing the URL or opening a bookmark. Organic search adds another 13%, while social and referrals together account for just 5%. For a product this size, that level of direct traffic points to strong habitual use.
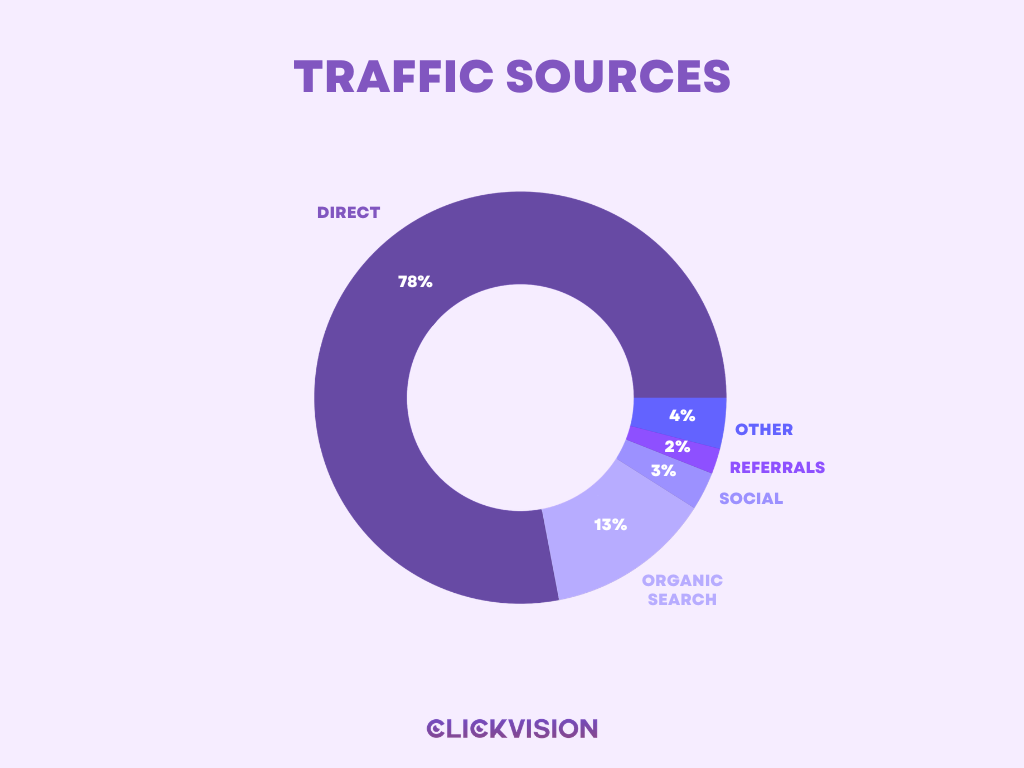
- Organic vs paid search split: 91.66% organic, 8.34% paid.
- YouTube drives 49–57% of all social traffic to Claude.
- Keyword “Claude” alone drove 4.3M organic visits in December 2024.
- Total referring websites: 845 | Keywords driving traffic: 87,900.
Demographics
| Age group | Share |
| 18–24 | 51.88% |
| 25–34 | 25% (rising to 33.99% by Nov 2025) |
| 35–44 | 11.88% |
| 45–54 | 8.13% |
| 55–64 | 2.21% |
| 65+ | 1.14% |
- Gender (Semrush/search-driven):
77.1%
male
22.9%
female
Geography
| Country | Users (Jan 2025) | Traffic share (Feb 2026) |
| United States | 3.2M | 32.41% |
| India | 2.1M | 7.02% |
| UK | 516,800 | 4.65% |
| France | — | 3.65% |
| South Korea | 556,700 | 3.43% |
| Japan | 692,200 | — |
| Kenya | 523,600 | — |
| Germany | 491,100 | — |
| Indonesia | 453,500 | — |
| Brazil | 327,600 | — |
| Rest of world | — | 48.84% |
- Available in 177 countries.
- US + India combined = 33.13% of total users.
Usage Breakdown
- 34% of all Claude tasks involve computer and mathematical work — the largest single category.
- Bug fixing = 6% of Claude.ai conversations, 10% of enterprise API traffic.
- Top 10 tasks = 24% of Claude.ai usage and 32% of API usage.
- 52% of interactions are “augmented” (user + Claude collaborating).
- 45% are “automated” (Claude acting independently).
- Enterprise API: automation dominates 77% of interactions.
- Internet-based research tasks spiked 90x after web search / Research mode launched in early 2025.
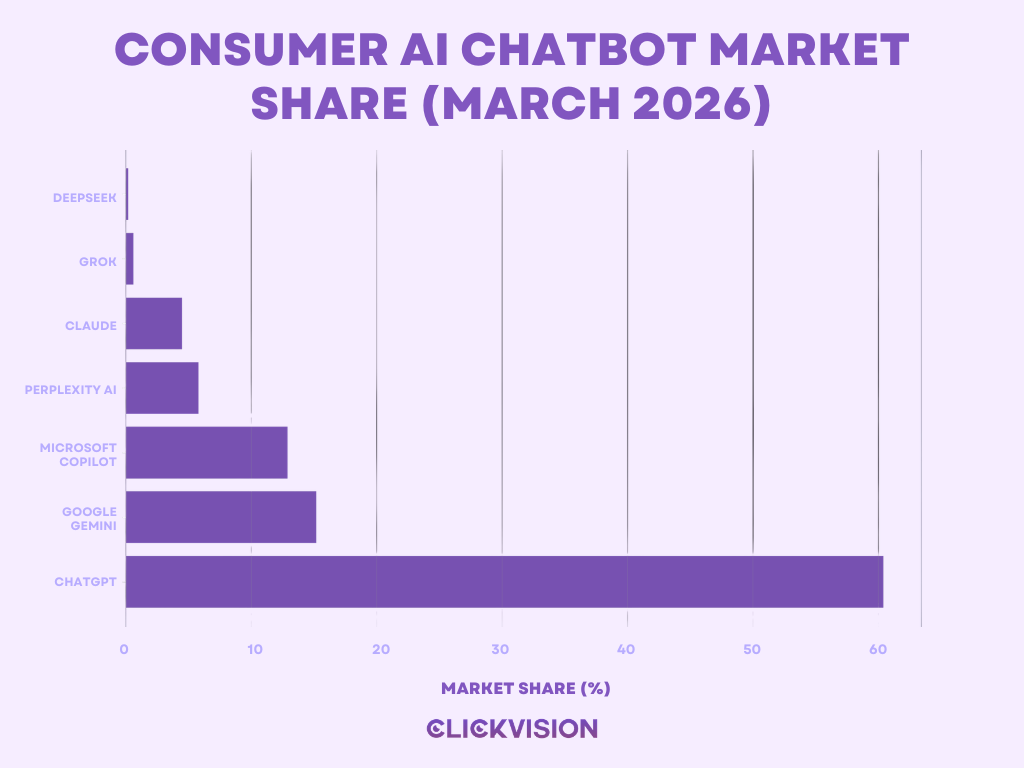
Market Share — Consumer AI Chatbots (March 2026)
ChatGPT still commands 60.4% of the consumer chatbot market — more than all other players combined. Gemini and Copilot fill out the middle tier. Claude sits at 4.5%, which looks modest on paper, but it’s worth noting that Claude’s share doubled year over year and it currently holds the fastest quarterly growth rate of any platform in this list.
Market Share — Enterprise LLM Spend
Anthropic has gone from 12% to 40% of enterprise LLM spend in three years, while OpenAI dropped from 50% to 27%.
| Company | 2023 | 2024 | 2025 |
| Anthropic | 12% | 24% | 40% |
| OpenAI | 50% | — | 27% |
| 7% | — | 21% |
- Anthropic + OpenAI + Google = 88% of enterprise LLM API usage.
- Total enterprise generative AI spend grew from $11.5B (2024) to $37B (2025) — a 3.2x increase.
Coding Market Share
- Anthropic: ~42% (mid-2025) rising to ~54% (December 2025).
- OpenAI: 21%.
- Anthropic has led LLM coding leaderboards for 18 straight months (since Claude Sonnet 3.5, June 2024).
- Claude Code accounts for ~4% of all public GitHub commits worldwide.
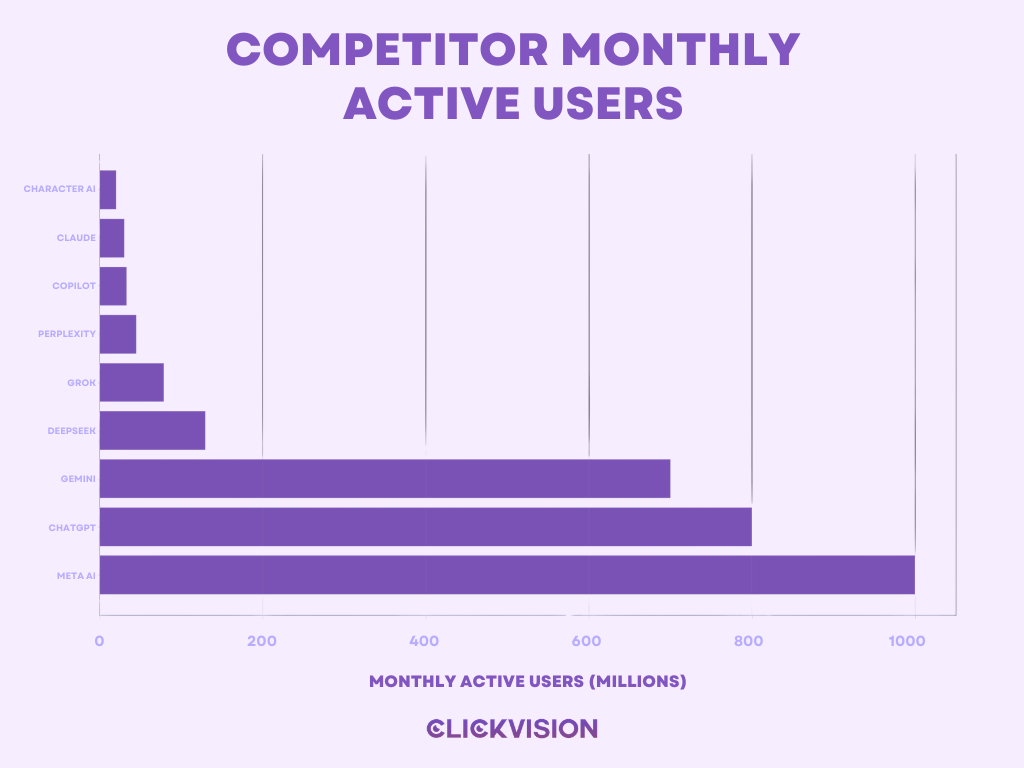
Claude vs Competitors — Active Users
At 30M MAU, Claude sits toward the lower end of this comparison — but the gap to the top is less about product and more about distribution. Meta AI benefits from being embedded across WhatsApp, Instagram, and Facebook. ChatGPT has years of brand recognition. Claude’s user base, by contrast, skews heavily toward professionals and developers, which partially explains why its enterprise revenue share tells a very different story than raw MAU numbers do.
Cross-Usage
Despite being one of the most capable AI assistants on the market, Claude still hasn’t fully broken through with the average ChatGPT user. The overlap data tells an interesting story: while 85.9% of Claude users also use ChatGPT, only 3–4% of ChatGPT users have tried Claude.
Claude AI Enterprise Usage Statistics
- 70% of Fortune 100 companies use Claude (Q2 2025) — 8 of the Fortune 10 are customers.
- Enterprise AI assistant market share: 29% (up from 18% in 2024).
- 6,000+ enterprise apps integrate Claude (Salesforce, Notion, Slack, etc.).
- 300,000+ business customers (October 2025).
- 100,000+ customers running Claude on Amazon Bedrock (April 2026).
- Customers spending $100K+ annually grew 7x in the past year.
- 1,000+ customers spending $1M+ annually (April 2026, doubled from 500 in under two months).
- 28% of global customer support tickets are handled via Claude-based AI.
- 25B+ API calls per month
- 97M Claude SDK downloads per month.
| Company | Deployment scale |
| Deloitte | 470,000+ employees across 150 countries |
| Cognizant | Up to 350,000 associates |
| Snowflake | $200M multi-year partnership, 12,600+ customers |
| Microsoft | ~$500M/year integrating Claude into products |
| Accenture | 30,000 employees |
| NEC | ~30,000 employees worldwide |
Claude Code
- Launched as standalone: February 2025 | Generally available: May 2025.
- Run-rate: $500M+ (Sep 2025) → $1B (Nov 2025) → $2.5B (Feb 2026).
- 29M daily installs on VS Code.
- Enterprise use = over half of Claude Code revenue.
- Dev teams reported 2–10x faster development velocity.
- ~4% of all public GitHub commits worldwide.
- SWE-bench score: 72.5%.
Claude AI Revenue Statistics and Growth
The revenue trajectory here is hard to overstate. Anthropic went from $45M in 2023 to a $30B run-rate by April 2026 — roughly a 10x increase every year for three consecutive years. The sharpest acceleration happened in 2025, where run-rate climbed from $1B at the start of the year to over $9B by year end. Enterprise API usage and the breakout success of Claude Code are the two primary drivers behind that curve.
- 70–75% of revenue from pay-per-token API calls.
- 80% of revenue is driven by enterprise/startup API calls.
- Subscriptions account for 10–15% of revenue.
- Projected 2026 revenue: $26B.
Margins and Financial Trajectory
| Metric | 2024 | 2025 | 2028 (projected) |
| Gross margin | ~-94% | ~50% | ~77% |
| Revenue | $850M–$1B ARR | $9B+ | ~$70B |
| Cash flow | Burning | Burning | ~$17B |
- Expects to stop burning cash in 2027, reach break-even in 2028.
- Estimated cloud infrastructure costs through 2029: ~$80B.
Funding and Valuation
| Round | Date | Amount | Valuation |
| Seed | May 2021 | $124M | — |
| Series B | Jan 2023 | $300M | ~$5B |
| Series D | Jan 2024 | $5M+ | — |
| — | May 2024 | — | $18.4B |
| Series E | Mar 2025 | $3.5B | $61.5B |
| Series F | Sep 2025 | $13B | $183B |
| Series G | Feb 2026 | $30B | $380B |
- Amazon total investment: $8B.
- Microsoft: $30B Azure compute + up to $5B investment
- Nvidia committed up to $10B.
- AWS committed new $5B + up to $20B more.
- Potential IPO being explored as early as 2026 (no confirmed plans)
Pricing
| Plan | Price |
| Free | $0 |
| Pro | $20/month ($17/month billed annually) |
| Max | $100–$200/month |
| Team | $30/user/month (5-seat minimum) |
| Enterprise | Custom |
| Model | Input per 1M tokens | Output per 1M tokens |
| Sonnet 4.5 | $3 | $15 |
| Sonnet 4.5 (200K+ tokens) | $6 | $22.50 |
| Opus 4.5/4.7 | $5 / $10 (extended) | $25 / $37.50 (extended) |
Batch processing: 50% savings. Claude Sonnet is up to 80% cheaper per token vs GPT-4 Turbo.
Technical Specs
- Standard context window: 200,000 tokens (can handle inputs over 1M tokens)
- Claude Opus 4.6: 1M token context window — first Opus-class model with this.
- Batch API: processes up to 10,000 queries per batch at 50% lower cost.
- Claude Sonnet: less than 5% accuracy degradation across its full 200K-token range.
- Effective capacity for most LLMs is 60–70% of advertised maximum — a 200K model typically becomes unreliable around 130,000 tokens.
Parameter Count: Claude vs. The Competition
Parameter counts across leading AI models are harder to come by than you’d think — most labs have stopped disclosing them entirely. What’s left are independent estimates, one confirmed figure, and a growing question about whether raw scale still matters as much as it used to.
Claude AI Performance Statistics and Benchmarks
Benchmarks only tell part of the story. Across most of the tests that matter, agentic tasks, coding, real-world tool use — Opus 4.6 leads or comes very close to the top. The gaps are narrow in some places and decisive in others.
| Benchmark | Opus 4.6 | GPT-5.2 | Gemini 3 Pro | Opus 4.5 | Sonnet 4.5 |
| Terminal-Bench 2.0 | 65.4% | 64.7% | 56.2% | 59.8% | 51.0% |
| SWE-bench Verified | 80.8% | 80.0% | 76.2% | 80.9% | 77.2% |
| OSWorld (Computer Use) | 72.7% | — | — | 66.3% | 61.4% |
| ARC-AGI 2 | 68.8% | 54.2% | 45.1% | 37.6% | — |
| BrowseComp (Agentic Search) | 84.0% | 77.9% | 59.2% | 67.8% | 43.9% |
| Humanity’s Last Exam (w/ tools) | 53.1% | 50.0% | 45.8% | 43.4% | 33.6% |
| GPQA Diamond | 91.3% | 93.2% | 91.9% | 87.0% | 83.4% |
| τ2-bench Retail | 91.9% | 82.0% | 85.3% | 88.9% | 86.2% |
| Finance Agent | 60.7% | 56.6% | 44.1% | 55.9% | 54.2% |
| GDPVal-AA Elo (Office) | 1,606 | 1,462 | 1,195 | 1,416 | 1,277 |
| MMMLU (Multilingual) | 91.1% | 89.6% | 91.8% | 90.8% | 89.5% |
| MMMU Pro Visual (w/ tools) | 77.3% | 80.4% | 81.0% | 73.9% | 68.9% |
Conclusion
Ultimately, the Claude AI statistics tell a story that raw rankings alone can’t capture. Yes, ChatGPT still leads in consumer market share. But Anthropic’s trajectory — from $45M in revenue to a $30B run-rate in just three years, reflects something more durable than hype. The enterprise dominance, the coding leadership, and the loyalty signals buried in engagement data all point to a platform building serious long-term momentum.
Whether you’re an investor, a developer, or just someone watching the AI space evolve, these Claude AI usage statistics are worth bookmarking. The landscape is still shifting fast, and Claude is clearly not done climbing.
Sources
- Claude Statistics: How Many People Use Claude?
- 100+ Key Claude Statistics You Should Know
- Claude AI Statistics 2026: Revenue and Market Share
- Claude Statistics 2026: 18.9M Active Users & $14B Revenue
- Anthropic (Claude AI) Statistics (2025)
- https://www.similarweb.com/website/claude.ai/
- https://sacra.com/c/anthropic/
- AI Model Parameter Counts: A Comprehensive Analysis
- Context Length Comparison: Leading AI Models in 2026
- Claude Opus 4.6 vs 4.5 Benchmarks (Explained)
- Claude Statistics And User Trends 2026